This paper was co-authored by FTSE Russell, GIC, and GMO.
FTSE Russell authors: Lily Dai, Senior Research Lead, Sustainable Investment Research; Jaakko Kooroshy, Global Head of Sustainable Investment Research
GIC authors: Rachel Teo, Head of Sustainability and Total Portfolio Sustainable Investing; Wong De Rui, Lead, Sustainable Investment Research, Sustainability Office
GMO authors: Deborah Ng, Head of ESG and Sustainability; Christopher Heelan, Quantitative Research Analyst, ESG Research Platform; Kenneth Hsu, Quantitative Research Analyst, ESG Research Platform; Timothy Wheeler, Quantitative Research Analyst, ESG Research Platform
Download the full paper here.
Executive Summary
Transitioning to a green net-zero economy requires climate solutions that enable the economy to decarbonise, such as renewable energy, electric vehicles, and recycling technologies. This also creates significant investment opportunities—companies providing climate and environmental solutions have been growing 1 and outperforming the market over the last decade. The economics of climate solutions are making fossil-fuel-dependent assets less attractive from a financial point of view. These companies are likely to grow even more as economies progress toward their net-zero goals.
There is an emerging toolbox for systematically identifying and managing portfolio exposure to climate-related investment opportunities. Different metrics are typically employed across investors and asset classes, such as dollar amount invested in green bonds for fixed income, and renewable energy generation for infrastructure. These metrics, while helpful for measuring specific sectors or asset classes, are challenging for investors to use due to their lack of comparability.
To address challenges in measuring climate solutions exposure, this paper examines four metrics: green revenue, green capex, green patents and avoided emissions that are broadly applicable in a portfolio management context. Each metric has its pros and cons but, altogether, they provide a comprehensive view of the available metrics to assess companies’ exposure to climate solutions. This paper focuses on green revenue based on its benefits. Green revenue is easier to interpret, directly links to companies' cash flows and real-world impact, and the data is more readily available and comparable.
We find Weighted Average Green Revenue (WAGR) to be the most promising metric currently for integrating climate solutions measurements into portfolio construction. It builds on the portfolio weighting methodology used in carbon metrics such as Weighted Average Carbon Intensity (WACI) that is widely adopted by investors. WAGR calculates the green revenue percentage (GR%) of a portfolio by applying company GR% to the portfolio weight of each company. Investors can set portfolio-level targets of climate solutions using WAGR, such as a minimum level, an improvement relative to the benchmark, or to track specific WAGR pathways such as decarbonisation trajectories.
Using WAGR, this paper analyses portfolio exposure to climate solutions, including size, growth, industries, green sectors, regions, and the level of ‘greenness’ (shown by the tiering structure under the FTSE Russell Green Revenues Classification System), with the FTSE All-World Index as the reference portfolio. Figure 1 shows that FTSE AllWorld’s WAGR grew from 5.5% to 8.6% between 2016 and 2021 and fell during the down market of 2022. In comparison, FTSE All-World’s unweighted green revenues record steadier year-on-year growth, which reflects the ‘value impact’ of market capitalisation.
Figure 1: WAGR of the FTSE All-World
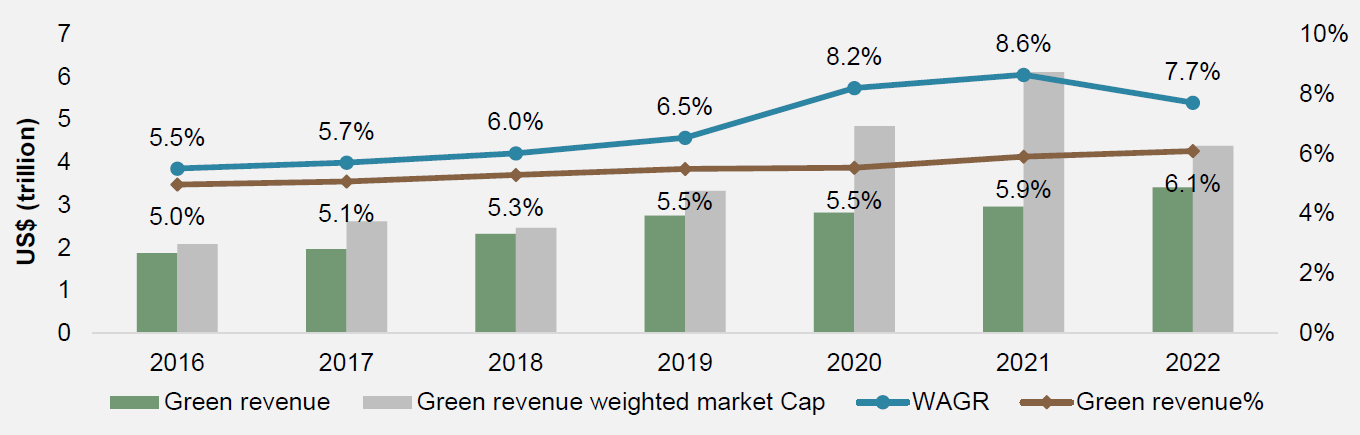
Source: FTSE Russell, April 2023
Akin to WACI, potential investor applications of WAGR include climate reporting against frameworks, such as the Task Force on Climate-related Financial Disclosures (TCFD), target setting, thematic investing, and corporate engagement. Investors should acknowledge the constraints and trade-offs when building portfolios with a significantly greater WAGR, such as sector and country concentration, volatility, and the size of the universe.
Disclosures based on green revenues are still nascent and would likely improve over time with the adoption of reporting based on different green taxonomies. In addition, climate-related disclosures in private markets, including green revenue data, continue to be in short supply, and limits access to comparable data across different asset classes for investors. This paper aims to raise greater awareness of the value of WAGR to assess and integrate green opportunities into portfolio construction, which in turn will encourage greater disclosures. In conjunction with other sustainability metrics, WAGR can be a useful tool to calibrate and measure exposure to climate solutions in a portfolio management context.
PAPER EXCERPT: WAGR IN ACTION – GMO HORIZONS CASE STUDY
Target exposure
A portfolio can use WAGR to target an increase in its exposure to climate solutions and the broader green economy. For example, the FTSE EU Climate Benchmarks Index Series uses the target exposure framework 20 and sets the target of increased WAGR compared to the benchmark. 21
GMO, a global investment manager known in part for its early thinking about the investment implications of climate change, manages a dedicated Climate Change Strategy, which uses an active, value-based approach to climate investing. Since its inception in 2017, the strategy has achieved an average annual return of 13.6% net of fees 22 , compared to its benchmark return of 8.3%, underscoring the profitability associated with efforts to mitigate and adapt to climate change, which is largely independent of the global economy. 23 Using FTSE Russell data, the strategy provided an average WAGR of 39.3% between 2017 and 2022.
In 2022, GMO began to explore the creation of a systematic, lower-cost, higher-capacity approach to investing in climate solutions using the FTSE Russell Green Revenues data.
The transition to a green economy is still in its early stages, resulting in relatively low WAGR for market capitalisation-based indices. In 2022, the WAGR of the FTSE All-World Index was less than 8%. To achieve portfolios that resemble an index but have a significantly greater WAGR, large positioning deviations are necessary. To investigate this point, GMO examined long-only, fully-invested portfolios with a minimum value of WAGR that are closest to the index. 24 Figure 9 shows the active share relative to the FTSE All-World Index of such portfolios with varying minimum levels of WAGR—the higher the WAGR requirement, the greater the active share needed to reach that requirement.
Figure 9. Active share required rises with higher WAGR needs
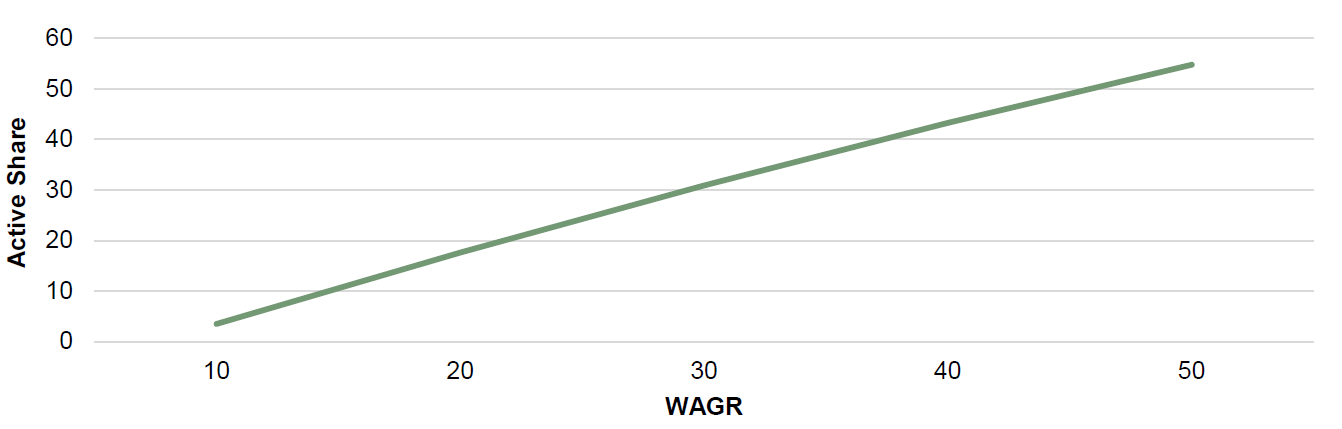
Source: GMO, April 2023
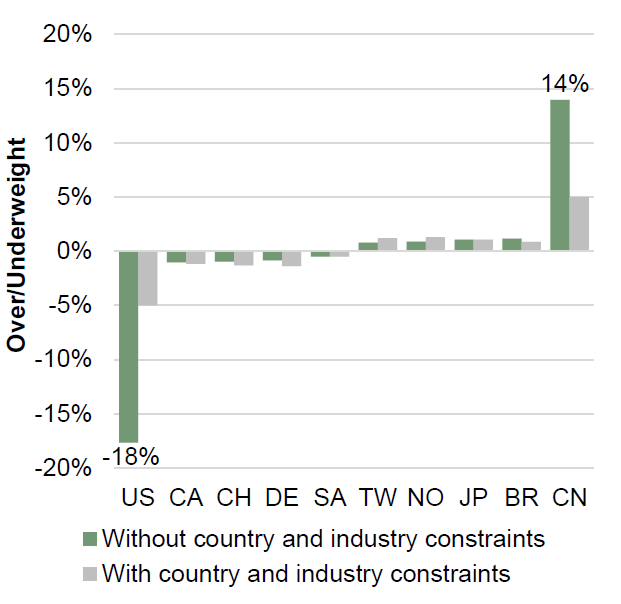
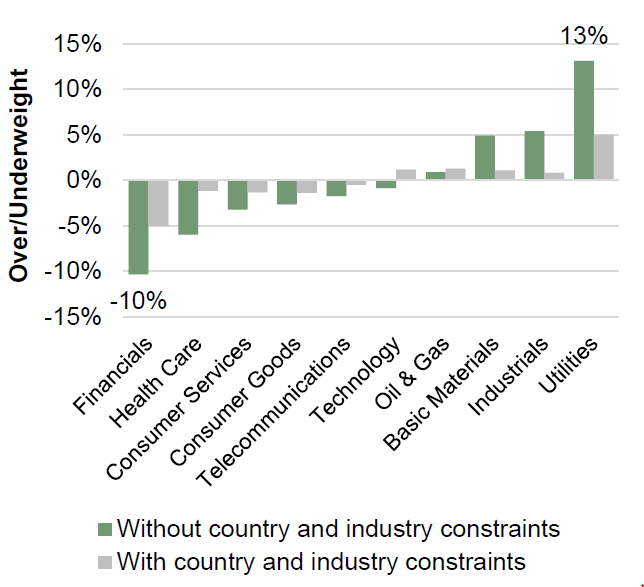
We also find these portfolios have concentrated exposures to certain countries and industries (figures 10 and 11). For example, a portfolio with 50% WAGR has a 14% overweight on China and an 18% underweight on the United States. The next largest country over/underweight is a mere 1%. At the industry level, this portfolio has a 13% overweight on utilities, and a 10% underweight on financials. The next largest industry over/underweight is 6%, which is not as extreme a decline compared to the country allocations. However, some investors may still prefer greater diversification at the industry level.
One approach to mitigating the issues of concentrated country and sector exposures is to constrain the maximum allowed over/underweights on these factors. With a WAGR of 50% and additional constraints limiting the country and industry over/underweights to ±5%, the resulting allocations are more manageable.
Figure 10. Country over/underweights for 50% WAGR portfolios |
Figure 11. Industry over/underweights for 50% WAGR portfolios |
 |
 |
Source: GMO, April 2023
A natural question that may arise is how these additional constraints affect portfolio exposure to climate opportunities. While both portfolios have a WAGR of 50%, they may attain this value in different ways. Although the extreme country and industry allocations have been significantly muted, it is good to note that some green characteristics of the portfolio have not been drastically altered (figure 12).
For example, when WAGR is decomposed into contributions from different green sectors, aside from a 3% reduction in energy generation, the overall distribution has retained its general shape. Moreover, 17 companies appear in the top 25 holdings in both portfolios.
Figure 12. Contributions of green sectors to WAGR
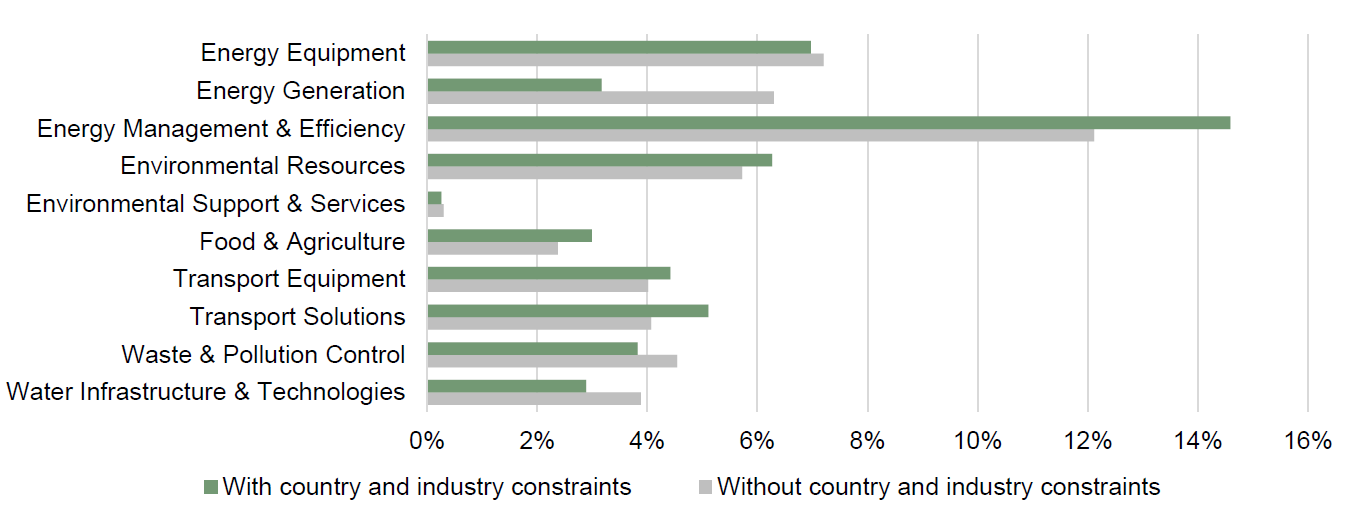
Source: GMO, April 2023
This simple example reveals how to achieve high levels of WAGR and maintain the characteristics of the index at the country and industry level.
In designing its own systematic GMO Horizons portfolio, GMO seeks to ensure that the pursuit of green revenues does not come at the expense of other environmental and societal needs. In particular, GMO believes that consideration of emissions is an essential part of sustainable investing. GMO uses scope 1 to measure direct emissions and the GMO Indirect Emissions Model 25 to measure upstream and downstream indirect emissions across end-to-end company value chains. This provides a more complete picture of emissions 26 generated throughout each firm’s value chain that is comparable across firms, unlike the scope 2 and scope 3 measures outlined by the Greenhouse Gas Protocol 27 .
Looking at the scatter plot of emissions intensities vs. green revenue percentages in figure 13, GMO finds that, in general, companies with lower green revenues have higher emissions intensities. However, there are times when high green revenues are accompanied by high emissions intensities. Therefore, it is essential to consider how emissions should play a role in the portfolio construction process.
While the primary objective of the GMO Horizons portfolio is to gain exposure to green revenues that contribute to mitigating or adapting to climate change, we also want to manage the emissions produced to generate green revenue but do so in a way that does not filter out companies that have both strong contributions to green revenue and higher emissions. Consider the case of a wind turbine manufacturer. Almost all the emissions are incurred upfront by the manufacturer, while the emissions avoided over the average 30-year life span of the turbine far exceed the initial emission cost. 28
Figure 13. Companies with lower percentages of green revenues often have higher emissions intensities
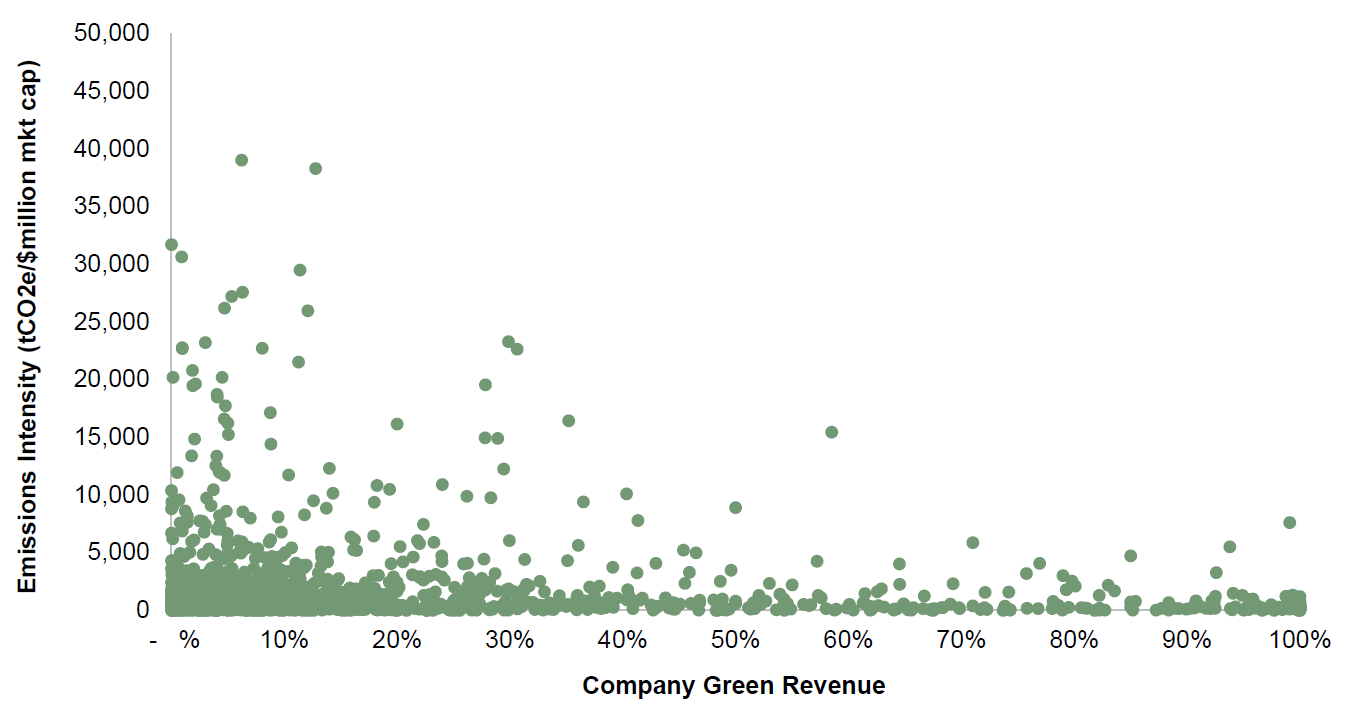
Source: GMO, April 2023
To manage significant ESG risk exposures in the GMO Horizons portfolio, GMO applies the following strategies. First, it requires the portfolio to have a better ESG score than the index, ensuring the portfolio prefers companies that have effective ESG practices. Second, GMO seeks to avoid the worst companies, defined as companies that may be in breach of global norms and internationally accepted standards, such as the UN Global Compact Principles, the UN Guiding Principles on Business and Human Rights, and the OECD Guidelines for Multinational Entities.
Eliminating controversial companies and optimising the emissions intensity of the portfolio may lead to a concentration of either portfolio positions or green revenue contributions. While this is mitigated by the relative country and sector constraints mentioned above, GMO’s Horizons portfolio seeks further diversification by managing the number of securities held in the portfolio, as well as the number of firms that contribute to the overall WAGR of the portfolio.
Taking all these considerations into account, the resulting portfolio can provide substantially more green revenue, lower emissions intensity, better ESG practices, and minimal exposure to egregious corporate conduct. Table 3 shows the average green revenue financed by a US$1 million investment in the GMO Climate Change Strategy, the FTSE All-World Index and the hypothetical GMO Horizons portfolio.
Table 3. Substantially more green revenue financed per US$1 million investment in the GMO Horizon portfolio’s climate-oriented and sustainable strategies than the standard market cap benchmark index
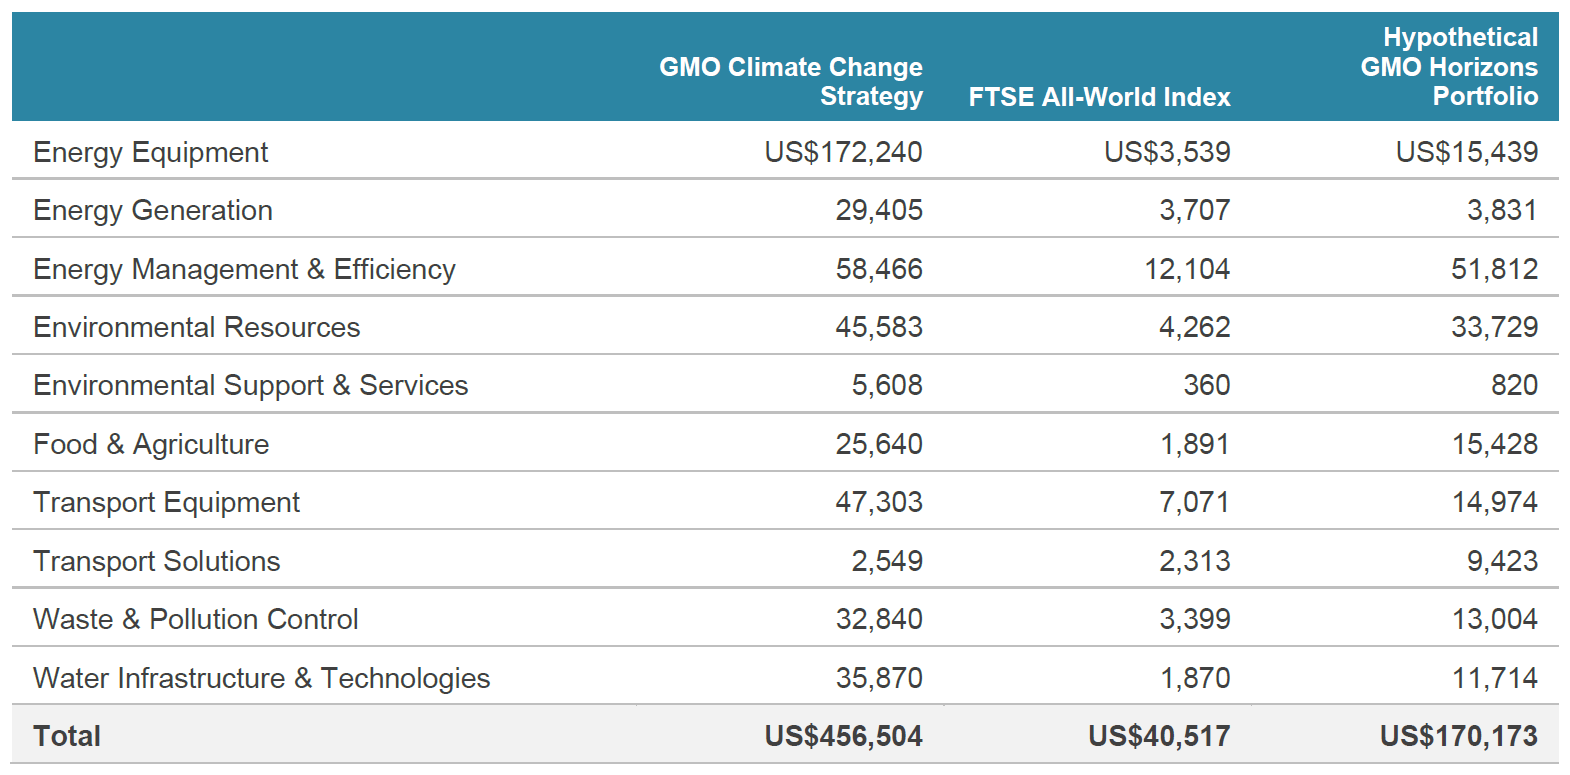
Source: GMO, February 2023
This example outlines some of the issues that were considered in building the GMO Horizons portfolio. At the core, the FTSE Green Revenues data provides a meaningful metric to target climate investment opportunities and quantifies the contribution of each firm to a more sustainable future. However, building a portfolio that provides an attractive risk-reward profile and meaningful exposure to green revenues is not as simple as tilting one’s portfolio. Given the current low level of green revenues in public equity markets, one must apply additional techniques to reach the approximate 39% exposure GMO has achieved through its Climate Change Strategy. At the same time, investors need to be thoughtful about how they manage potential negative impacts, such as direct and indirect emissions, controversial corporate behaviours and poor ESG practices.
Acknowledgements: The authors would like to thank Ng Xiang Long, Trang Chu Minh, and Nicholas Goh (GIC), David King and George Sakoulis (GMO), and Alberto Allegrucci and Lee Clements (FTSE Russell) for providing valuable comments and suggestions. The report, however, reflects the methodological choice and views of the authors alone.
As shown by green revenue in Figure 1.
FTSE Russell (2020). Target Exposure: Investment applications and solutions
FTSE Russell. EU Climate Benchmarks.
Performance data quoted represents past performance and is not predictive of future performance. Please click here for more recent performance.
As of 31st January 2023.
Here, distance between two portfolios is measured by taking the Euclidean norm of the difference between their respective weight vectors.
Christopher Heelan, Kenneth Hsu, Timothy J. Wheeler, Deborah Ng (2023). Estimating Value Chain Emissions for Portfolio Construction: The GMO Indirect Emissions Model [Unpublished manuscript]. GMO Research Library, GMO LLC.
GMO includes Scope 2 and Scope 3 emissions together in its Indirect Emissions Model.
GHG Protocol establishes comprehensive global standardized frameworks to measure and manage greenhouse gas (GHG) emissions from private and public sector operations, value chains and mitigation actions. See https://ghgprotocol.org/
National Renewable Energy Laboratory (NREL) (2021). Life Cycle Greenhouse Gas Emissions from Electricity Generation: Update.