Executive Summary
Fourth quarter 2022 returns reflected a partial recovery from the deterioration of global economic and market conditions of the previous three quarters:
- Hard Currency Debt EMBIG-D returned +8.1%: 7.6% from tightening spreads and 0.5% from USD rates.
- Local Debt GBI-EMGD returned +8.5%: +5.5% from currency and +3.0% from local rates.
Valuation metrics across all but the U.S. interest rate dimension remain unambiguously attractive.
- Hard currency debt valuations Although our credit multiple metric compressed over the quarter, it remains firmly in our attractive zone. U.S. dollar interest rates are a tougher call, with short-end rates high relative to the Fed’s inflation target yet low relative to delivered inflation; meanwhile, the curve is inverted with the 10y vs. 2y slope at –0.76 (as of Jan 12th).
- Emerging Currencies have gained in attractiveness as cyclical factors join valuation factors in support.
- Local interest rate continue to point to attractive levels relative to U.S. dollar interest rates.
In this piece, we update our valuation charts and commentary, with additional details on our methodology available upon request.
External Debt Valuation
The EMBIG-D benchmark’s mid-spread over Treasuries tightened by 107 bps in Q4, ending the quarter at 463 bps. As seen in Exhibit 1, the fair market multiple is the benchmark’s credit spread to the spread that would be required to compensate for credit losses. This ratio fell considerably over the quarter. The multiple stood at 3.3 on December 30, 2022, down from 4.3 on September 30, 2022.
A NOTE ABOUT OUR METRICS
QVU metrics are designed to give asset allocators a time series of risk premia associated with the two sovereign emerging debt benchmarks for hard and local currency. The purpose is to help allocators time investing decisions. Our team uses them to create blended benchmark portfolios. We cover the pricing of credit in EMBIG-D; and currencies and rates in GBI-EMGD by comparing prices to relevant fundamentals.
Technical appendices covering methodology are available from your GMO representative.
Exhibit 1: Long-Term View of the "Fair Market Multiple" for Emerging External Debt
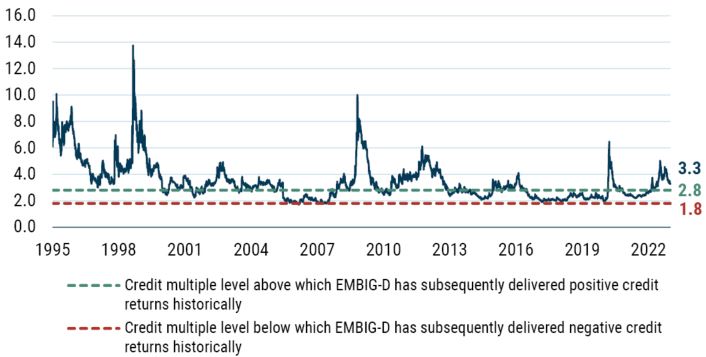
As of 12/31/2022 | Source: GMO calculations based on Bloomberg and J.P. Morgan data
Credit spread tightening was the main driver for the decrease in the multiple over the quarter, as the multiple’s denominator – the fair value spread or expected credit loss – rose slightly during the quarter. 1 Regular readers will recall that this fair value spread is a function of the weighted-average credit rating of the benchmark, along with historical sovereign credit transition data and an assumption about recovery values given default. 2
U.S. Treasury yields rose, and the curve remained inverted during the quarter, with the 10-year yield rising by 5 bps and having little impact on benchmark returns. While long-end U.S. Treasury yields trended upward during the quarter, the slope of the 10-year forward curve became slightly less inverted, from -23 bps to -21 bps as of the end of December (the entire curve shifted lower by about 5-15 bps). Given the marginal change in slope during the fourth quarter, the prospective relative valuation of 10-year risk-free rates versus cash is about the same relative to the previous quarter. This indicates the market is pricing in slightly less of a cushion for rising rates, as the forward curve represents the path that would make an investor indifferent to holding Treasuries and cash.
Exhibit 2: 10-Year U.S. Treasury Swap Curves at Quarterly Intervals
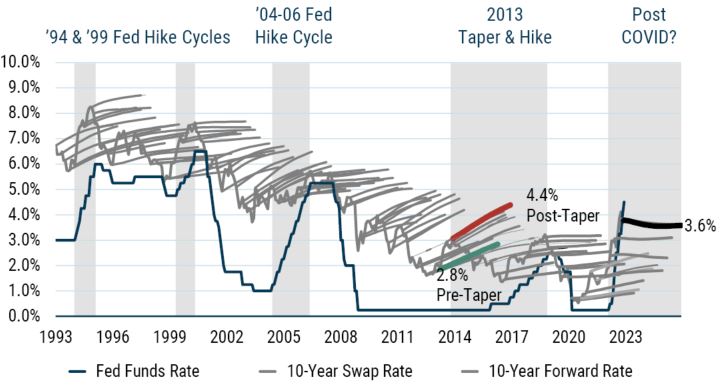
As of 12/31/2022 | Source: GMO
Local Debt Markets Valuation
In local EM markets, we use a similar valuation metric to consider the relative attractiveness of the asset class. Our overall GBI EM FX return barometer improved beyond the upper end of the neutral range during the quarter. The improvement in the inflation and growth environment in the fourth quarter led to a more attractive valuation. On the other hand, our new EM local interest rate valuation metric, which looks at the deviations of current yields from their fair value yield, while lower again this quarter, remains fairly positioned versus historical standards and very wide when compared to the same measure of U.S. interest rate valuations.
Exhibit 3 shows a time series of our EM FX model estimate of the GBI-EMGD benchmark’s spot FX valuation. EM currencies ended December above the upper end of the neutral range. When we decompose our EM FX valuation signal into proxies of its three components (long-term valuation, balance of payments, and economic cycle), we find that EM FX remains cheap from a long-term valuation perspective during the quarter while remaining neutral from a balance of payments perspective. However, this quarter the economic cycle pillar has been improving as the inflation environment has become more benign, as we had anticipated.
Exhibit 3: GBI-EMGD Expected Spot FX Return Given the Fundamentals
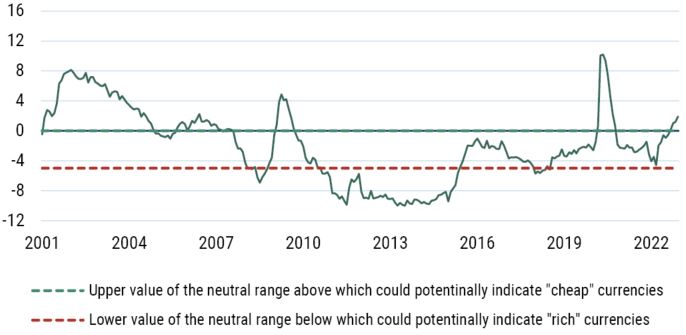
As of 12/31/2022 | Source: GMO
As for EM local interest rates, we use the framework introduced at the end of the first quarter to assess EM interest rate valuation. We consider the deviations of current 5-year yields from their fair value to gauge relative attractiveness of EM against the U.S. (see Exhibit 4). In this regard, we believe that the best time to buy local debt is when EM deviation from Fair Value is positive and higher than the U.S. deviation from its fair value. We continue to see a substantial positive gap between EM and U.S. deviations. In fact, that spread between EM and U.S. deviations widened by 7 bps during the quarter to 118 bps. Having been stable for several years, the 5-year average of the spread between EM and U.S. deviations rose in Q4, from 64 bps to 68 bps.
Exhibit 4: Local Interest Rate Relative Valuation vs. U.S. Rates
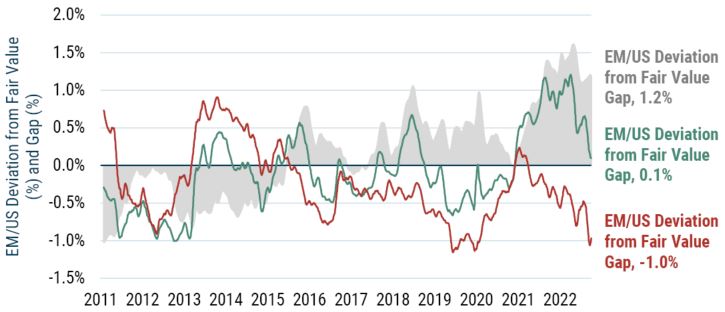
As of 12/31/2022 | Source: GMO
Fair value estimates and differentials are based on 20-day rolling averages.
Liquidity
One key feature of EM debt is low baseline and occasionally very poor liquidity. We consider this a feature of EM and GMO’s portfolios seek to manage this risk while extracting well-compensated illiquidity premia as appropriate. Over the course of the quarter, we observed a continued deterioration in liquidity, although not to the stressed levels that occurred around the initial shock of Russia’s invasion of Ukraine in February (see Exhibit 5).
Exhibit 5: EMBIG-D Bid-Ask Spread (% of price),
Since December 1993
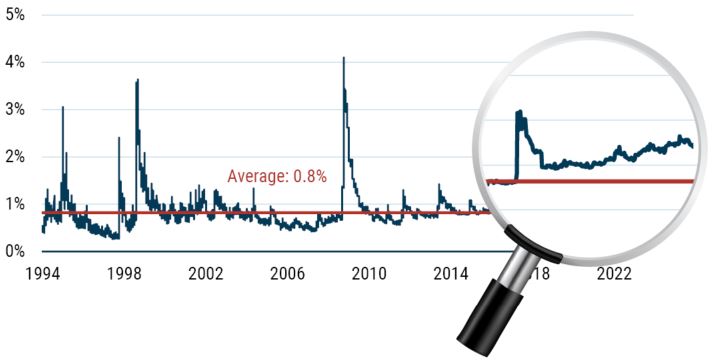
As of 12/31/2022 | Source: GMO
Investing from a Non-USD Perspective
The preceding discussion addresses asset class valuations from a USD-based investor’s perspective. For investors from other home currencies, we discuss the valuation of the USD relative to the EUR, CAD, and AUD (Exhibit 6) and current hedging costs (Exhibit 7). Hedging costs for EUR, AUD, and CAD rose in a year of extraordinary macro conditions, and we currently view all three major non-USD base currencies as cheap. This also points to the fact that the USD looks expensive against largely all other developed market currencies. Our fixed income quantitative team sees this as a signal of a potential long-term downward trend of the USD based on its long-term PPP valuation model.
In summary, we note the favorable credit environment for external debt but emphasize the uncertainty of current events and rate movements on this outlook. The EM FX valuation outlook now offers an attractive picture, given that EM FX remains cheap from a pure valuation perspective (Pillar 1) but has been improving from an economic cycle’s perspective (Pillar 3). Lastly, a stretched USD valuation could suggest a secular downward trend with the related medium-term expectations of stronger EM currency valuations down the road. Finally, the deviation of local yield from its fair value for EM and the U.S. respectively, while lower remains wide versus history, making EM local debt relatively attractive from that perspective.
Exhibit 6: Historical Currency Valuation since 2001
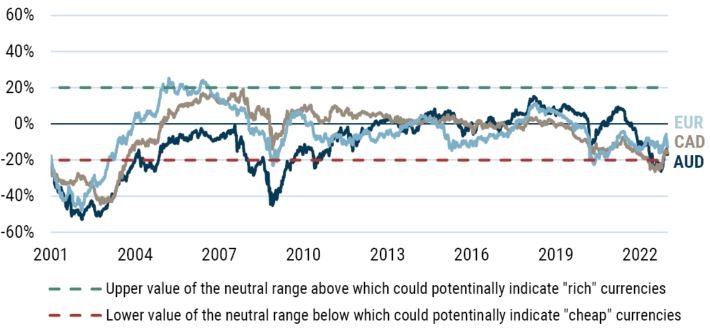
As of 12/31/2022 | Source: Bloomberg, J.P. Morgan, GMO
Exhibit 7: Annual Roll Yield Difference when Hedging USD to AUD, CAD, and EUR Base
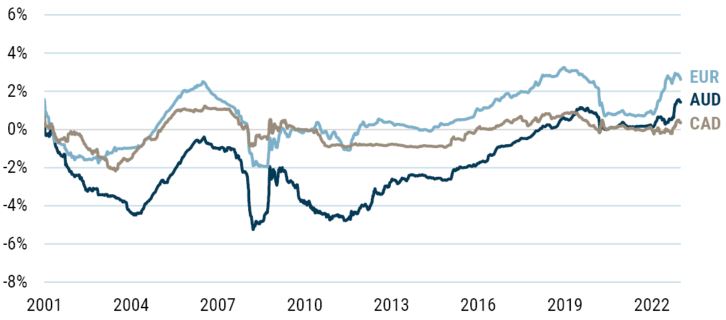
As of 12/31/2022 | Source: Bloomberg, J.P. Morgan, GMO
Download article here.
Subscribe to GMO Research
We updated the credit transition matrix based on the 2021 S&P default study published earlier this year and restated our entire fair value history.
We are assuming a 25% recovery rate in a default state, which is the same for both sovereigns and quasi-sovereigns. We’ve recently enhanced this process to reflect the ratings of quasi-sovereign issuers instead of assuming sovereign ratings for all benchmark constituents. The overall effect is minor given the small percentage of quasi-issuers that have a different rating than the sovereign. Specifically, to calculate the weighted-average credit ratings of the benchmark, the bonds for each country are first divided into sovereign and quasi-sovereign categories. For each quasi-sovereign issuer, we use the S&P credit ratings specific to that entity if available; otherwise, its corresponding sovereign credit ratings are used. The weighted average is a market-value weighted average of these individual ratings corresponding to each bond.