
Listen to this Insight
GMO’s liquid alternatives are hedge fund strategies (e.g., equity long-short, global macro, event-driven) managed with an emphasis on risk control and liquidity. The GMO Alternative Allocation Strategy (“ALTA”) is a liquid alternative solution combining several underlying strategies; ALTA is available in a mutual fund with daily liquidity.
While liquid alternative strategies have been a consistent component of our multi-asset opportunity set for over 25 years, general investor interest has waxed and waned. Some gave up on the category after being disappointed by lackluster returns, or because they were surprised by higher-than-expected correlations to traditional markets. Many investors simply focused their efforts elsewhere—specifically, on illiquid alternatives.
Investors are increasingly prioritizing diversification and liquidity, bringing a revival of attention to this category of strategies. Investors are realizing that:
- Bonds don’t diversify in all scenarios.
- Macro conditions, which have supported private equity, have ended.
- Illiquid alternatives are failing to live up to inflated promises.
Bonds Are Diversifying, Just Not Magically So
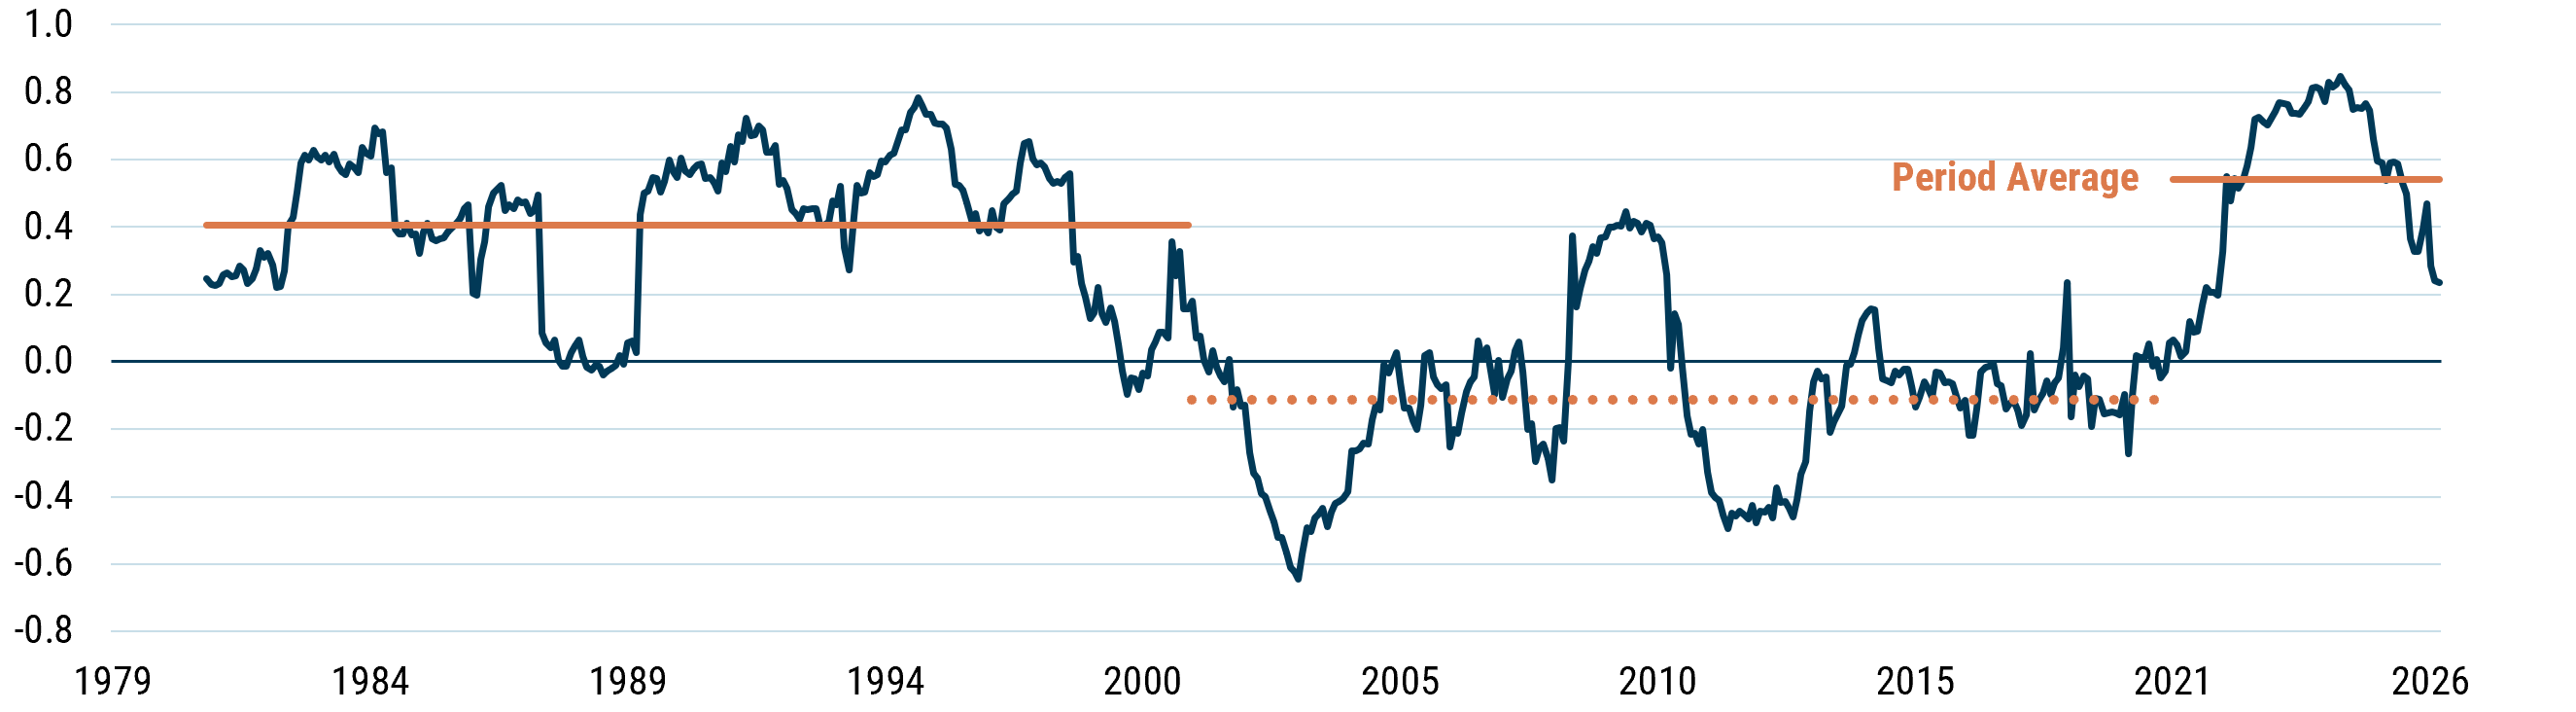
Portfolios benefit from assets that are exposed to different risks and therefore do not move precisely in tandem. With stocks, investors are underwriting the risk of an economic downturn. With bonds, investors are underwriting the risk of unexpected inflation. In a downturn, bonds often perform well as rates fall, providing a measure of diversification, safety, and liquidity. For over two decades, stocks and bonds exhibited a negative correlation, leading some investors to conclude that this is all the diversification you need.
Exhibit 1: S&P 500–Bloomberg U.S. Aggregate Rolling 2-Year Correlation
As of 6/30/2026 | Source: GMO
At GMO, we have never believed that the true correlation between stocks and bonds is negative. They are both long-duration assets and therefore there is a clear fundamental link. 1 In 2022, that became painfully obvious as all long-duration assets repriced—the S&P 500 was down 18%, as was a 10-year U.S. Treasury. A year ago, following "Liberation Day," bonds sold off, and again, with the onset of the war in Iran, bonds failed to protect.
Bonds are diversifying, but not magically so; investors need other diversifiers as well.
The Goldilocks Era Is Over
The past four decades have been a perfect environment for investing. Risky, highly leveraged strategies like private equity flourished, supported by a secular bull market in rates and a stable and improving global economy—low inflation, consistent incremental gains from globalization, and limited geopolitical conflict.
In this Goldilocks era, investors were comfortable and happy to sacrifice liquidity and take additional risk in pursuit of higher returns.
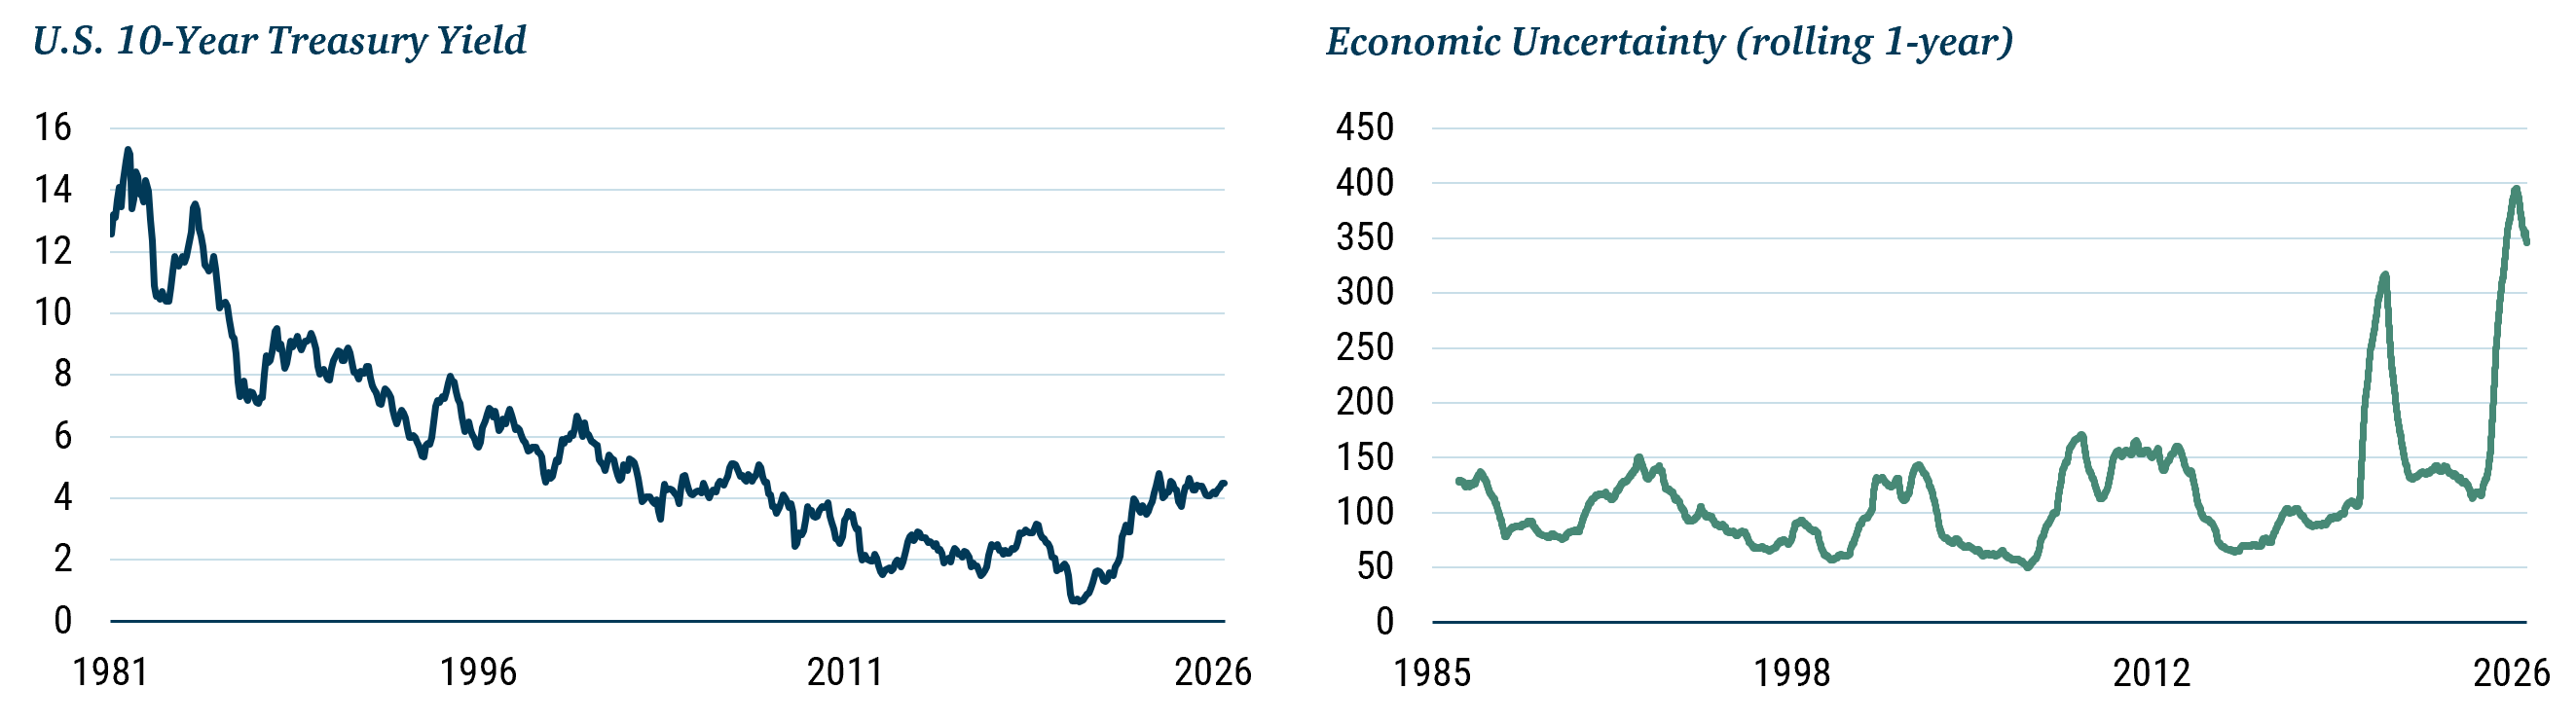
But those macro tailwinds have ended and may be turning to headwinds. At a starting yield of 4% (rather than 14%), investors can’t count on rate declines. Corporations are focused on supply chain resilience and nearshoring/friendshoring, and conflict is rising. The St. Louis Fed's Economic Policy Uncertainty Index has consequently leveled up over the past five years (Exhibit 2, right), in a clear departure from the prior period of stability. Increased uncertainty may give investors pause about committing to a long-term capital lockup and cause concern about the ultimate exit environment.
Exhibit 2: The Goldilocks Era Is Over
Left Chart: As of June 2026, Right Chart: As of July 2026 | Source: GMO
Illiquid Alternatives: Promise vs. Reality
Many allocators had prioritized building an illiquid alternatives allocation expecting a meaningful impact on total portfolio results.
Along with the promise of higher returns came other features:
- The diversification element of adding a new asset class,
- Limited liquidity (while problematic, investors believed that lockups were necessary to reap rewards, hence the term “illiquidity premium”), and
- A vehicle that gave the GP considerable flexibility in their quest for alpha.
We are now finding that the reality has not lived up to the original advertising.
Diversification?
Private equity provides only optical diversification as marks are stale and subject to judgment. Not updating the asset’s price gives the appearance of low volatility and low correlation, but that is merely an illusion. Investors are underwriting the same fundamental risks as publicly traded equivalents—both expose you to economic downturn and specific business threats—so there is no genuine diversification.
Liquidity?
Investors were informed that their capital would be locked up with distributions typically starting several years after the initial investment, but the period of illiquidity can be materially extended when the exit environment is weak. Distributions for private equity and venture capital have fallen off by 50–60% compared to five years ago (MSCI). With fewer overall exit opportunities, PE firms have turned more than usual to selling to themselves through the use of continuation funds, which represented 20% of overall PE exits in the last year (Heal 2026). Because the fund manager participates on both sides of the transaction, continuation funds may create conflicts of interest and lower realized IRRs.
With private credit, liquidity should not be a problem. While you can’t liquidate your investment quickly and easily like you could with a publicly traded security, a coupon payment provides regular liquidity. However, the vast majority of private credit issues have a payment-in-kind (PIK) toggle giving the issuer the option to pay the coupon in kind by increasing your principal rather than delivering cash. Issuers are increasingly opting for PIK (potentially as high as 15–20% of total issues 2 ) causing a liquidity crunch where one should not exist.
Liquidity is a critical resource for investors, allowing them to rebalance in times of stress and pivot when better opportunities arise.
Efficiency?
Private equity funds deploy leverage by borrowing to finance the balance sheet. This can feel like a free lunch in an era of declining interest rates, as debt is constantly rolled at lower rates. It becomes problematic when interest rates start to rise. 3
Returns?
“Performance persistence has largely disappeared as the PE market has matured and become more competitive,” (Braun et al. 2017). To put some numbers to it, the following data was recently published by Harvard Business School (Exhibit 3).
Exhibit 3: PE Returns Have Disappointed When Compared Like-for-Like
5-Year |
10-Year |
15-Year |
20-Year |
|
|
Direct Alpha |
-4.62% |
-0.92% |
-0.60% |
-0.04% |
Source: Gerardo Lietz 2025
When compared like-for-like, 4 private equity “alpha” relative to the S&P 500 is negative or zero at best. Early period results (when few were invested—mainly large institutions led by the Yale endowment) were the strongest, causing private equity to look roughly equal to public equity over a 20-year horizon, but the recent results show much worse performance from private equity than public. As capital has flowed into this space, more dollars are competing for fewer opportunities. 5
We don’t yet have data to judge the performance of private credit, but some analysts are predicting dire outcomes. 6 Roughly 25% of private credit investments are in software companies, and the durability of those business models is in question given advances in artificial intelligence. 7
Conclusion
We firmly believe that you need more than just stocks and bonds in your mix. Investors can’t count on protection from bonds, and some “alternative” investments simply compound pain in a bear market. As a result, investors are taking a fresh look at liquid alternative strategies that offer strong returns, true diversification to traditional assets, and reliable liquidity in one package.
See Ben Inker’s 2Q 2016 Quarterly Letter, “The Duration Connection,” available from your GMO representative.
“Over the past decade, PIK's contribution to listed BDCs' net investment income has doubled, from approximately 10% to over 20%,” (Corominas 2026).
Leverage through borrowing has different implications than leverage captured through dollar-neutral long-short strategies. Levering the balance sheet bears a cost that rises as interest rates rise. Long-short strategies are less sensitive to financing costs because financing costs on the long side are largely offset by payments received on the short side.
Private equity returns are stated as an internal rate of return (IRR), which is not comparable to the annualized returns posted for liquid assets. The IRR is calculated based on the period when cash is invested, so it is not necessarily compounded over a multi-year horizon, and managers can manipulate the results.
GMO research also finds that private equity portfolio companies are of poorer quality than their public equity counterparts, with greater industry concentration than one might expect. See What Barbarians Like to Take Private (Or: The Risks in Your Private Equity Portfolio) by Ben Inker and John Pease (May 21, 2026).
“We expect broad U.S. private credit returns to be negative, with investors experiencing up to a cumulative further 10% loss over the next two years,” (Corominas 2026).
A large allocation to software in a debt portfolio is somewhat baffling because the upside is limited to par, i.e., the debt being paid back in full. It makes a lot more sense to make risky software investments in the equity portfolio, where you can benefit from big winners offsetting some of the inevitable losers.
References
Braun, R., Jenkinson, T., & Stoff, I. 2017. How Persistent Is Private Equity Performance? Evidence from Deal-level Data. Journal of Financial Economics 123 (2), 273–291.
Corominas, Javier. 2026. Fixed Income: Why Private Credit Returns Will Continue to Unravel. Oxford Economics, March 30.
Gerardo Lietz, N. 2025. Should Mom Have Private Equity in Her 401K? Harvard Business School Working Paper No. 26-026.
Heal, Alexandra. 2026. “Private Equity Backers Raise New Conflict Concerns over Sweetheart Deals,” Financial Times, April 27.
S&P does not guarantee the accuracy, adequacy, completeness or availability of any data or information and is not responsible for any errors or omissions from the use of such data or information. Reproduction of the data or information in any form is prohibited except with the prior written permission of S&P or its third-party licensors. Please visit https://www.gmo.com/americas/benchmark-disclaimer/ to review the complete benchmark disclaimer notice.
Disclaimer: The views expressed are the views of the Asset Allocation team through the period ending July 2026 and are subject to change at any time based on market and other conditions. This is not an offer or solicitation for the purchase or sale of any security and should not be construed as such. References to specific securities and issuers are for illustrative purposes only and are not intended to be, and should not be interpreted as, recommendations to purchase or sell such securities.
Copyright © 2026 by GMO LLC. All rights reserved.
See Ben Inker’s 2Q 2016 Quarterly Letter, “The Duration Connection,” available from your GMO representative.
“Over the past decade, PIK's contribution to listed BDCs' net investment income has doubled, from approximately 10% to over 20%,” (Corominas 2026).
Leverage through borrowing has different implications than leverage captured through dollar-neutral long-short strategies. Levering the balance sheet bears a cost that rises as interest rates rise. Long-short strategies are less sensitive to financing costs because financing costs on the long side are largely offset by payments received on the short side.
Private equity returns are stated as an internal rate of return (IRR), which is not comparable to the annualized returns posted for liquid assets. The IRR is calculated based on the period when cash is invested, so it is not necessarily compounded over a multi-year horizon, and managers can manipulate the results.
GMO research also finds that private equity portfolio companies are of poorer quality than their public equity counterparts, with greater industry concentration than one might expect. See What Barbarians Like to Take Private (Or: The Risks in Your Private Equity Portfolio) by Ben Inker and John Pease (May 21, 2026).
“We expect broad U.S. private credit returns to be negative, with investors experiencing up to a cumulative further 10% loss over the next two years,” (Corominas 2026).
A large allocation to software in a debt portfolio is somewhat baffling because the upside is limited to par, i.e., the debt being paid back in full. It makes a lot more sense to make risky software investments in the equity portfolio, where you can benefit from big winners offsetting some of the inevitable losers.