Executive Summary
The S&P 500 has become an increasingly concentrated index over the past decade, with the top seven stocks now comprising 28% of the total, and the returns of those stocks far outpacing that of the average stock in the index. Active managers are systematically underweight the very largest stocks, and this is particularly true of concentrated high active share managers. If the purpose of a benchmark is to be a fair measuring stick to determine whether a manager has skill, a market capitalization-weighted index is not a good benchmark for most active managers, and this becomes increasingly true as the index becomes more concentrated. History suggests that the next decade is likely to see a reversal of the recent pattern with the capitalization-weighted version of the S&P 500 underperforming the equal-weighted version. In such an environment, active managers will suddenly look much better versus the S&P 500 and other capitalization-weighted benchmarks.
Patience is widely understood to be a virtue in investing. Many clients and investment committees pride themselves on their willingness to stick with high conviction managers through rough patches in performance in the belief that given sufficient time, skill will tell. But even patient investors have their limits, and this fall we saw an avalanche of questions coming in from institutions as to whether it is time to abandon active management, at least in U.S. large caps. We were a little surprised by this, since our U.S. large cap equity products have actually done well against their benchmarks over the last few years. 1 But a little digging made us realize that most clients’ experience with their active U.S. equity strategies has been pretty disappointing. According to Morningstar, 74% of U.S. large cap blend managers underperformed the S&P 500 last year. And it wasn’t just a single bad year. The decade ending in 2023 saw a stunning 90.2% of U.S. large cap blend managers underperform their benchmarks. After a brief respite for active managers in 2022, when 53% of U.S. large cap blend managers outperformed, it seems as if 2023 may be the last straw for many clients. How can you blame them? A decade is a lifetime in the investment world. If 90.2% of managers underperformed their benchmarks in U.S. large caps over the last decade, surely that is irrefutable evidence that the market is efficient?
The reality is somewhat different, however. As we will see, the reason why the S&P 500 and other U.S. large cap equity benchmarks have been close to impossible to beat over the last year and almost as hard to beat over the last decade stems from the nature of the stocks that have outperformed. The U.S. equity market has been growing steadily more concentrated. When the very largest stocks are the best performing ones, it is an extremely difficult environment for active managers to keep up with, let alone outperform. To outperform an index, it is necessary to look different from it. We tend to think of that difference in terms of the stocks that a manager owns, but as Cremers and Petajisto’s active share measure points out, what managers choose not to own is just as important as what they do own. 2 In order to make space in a portfolio for the stocks a manager wants to be overweight, they by necessity must have an equal and offsetting underweight in other stocks. While active share envisions this as running a long/short portfolio on top of the benchmark, the reality is that it is a highly constrained long/short. A manager can choose to be as overweight as they would like in their favorite stocks, but the underweights for a long-only manager are constrained by the weights of those stocks in the benchmark. 3 The biggest underweight for a manager will not be their least favorite stock, but the largest stock in the benchmark that they don’t like enough to have a substantial weight in. The upshot is that long-only active managers almost always have substantial bias against the very largest stocks in their benchmarks. This is particularly true of the extremely high active share “high conviction” managers beloved by endowments and foundations, who commonly have active shares in the 95% range. 4 For most of history, biasing portfolios against the very largest stocks has been lucrative. But over the last decade, and particularly the last year, it has been a disaster.
A narrow decade
If you look at the 10 largest companies in the S&P 500 (or any capitalization-weighted index, for that matter), odds are that the stocks of those companies meaningfully outperformed the broad market over the preceding decade. The largest companies in the world either started out large and kept up with their competition, or they started out small and outperformed most everyone who was larger. This was certainly the case over the last decade.
On a forward-looking basis, however, big is generally anything but beautiful. Exhibit 1 shows the relative return of the 10 largest stocks in the S&P 500 in the year following that ranking.
Exhibit 1: Top 10 Stocks vs. S&P 500
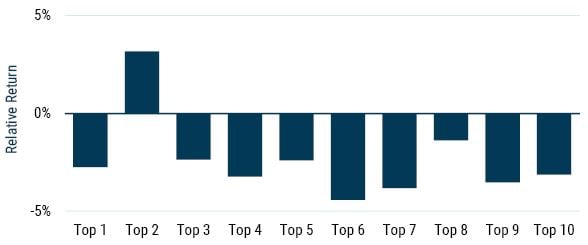
Data from 1957-2023 | Source: Compustat, Standard & Poors.
Nine of the top 10 have underperformed on average. 5 The historical underperformance of the top 10 comes down to the two main sources of return – valuation expansion and fundamental growth – being harder to achieve than for your average company. The largest stocks generally become the largest by way of becoming expensive, and this anti-value tilt has historically been quite costly, explaining most of these companies’ poor relative returns. 6 Good returns in the face of high valuations, moreover, require exceptional earnings growth. When a company already has a substantial market and profit share of the industries in which it operates, unusual growth tends to be significantly harder than normal. It can be particularly hard if the company’s growth catches the attention of anti-trust regulators.
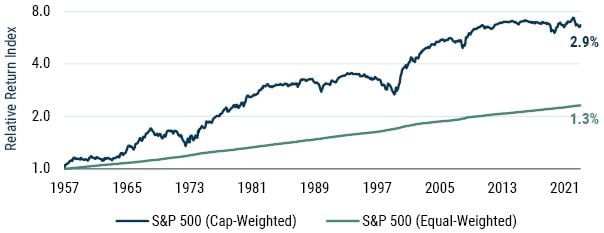
The largest stocks certainly don’t underperform all of the time, but on average, they have substantially trailed the average S&P 500 stock, as we can see in Exhibit 2.
Exhibit 2: S&P500 – Top 10 vs. 490 Equal Weighted
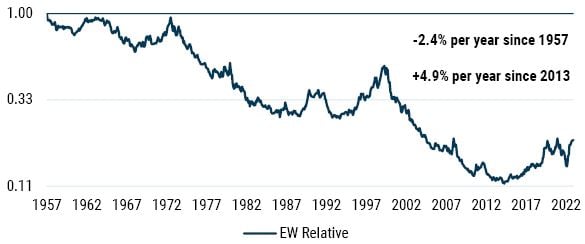
Data from 1957-2023 | Source: Compustat, Standard & Poors
Since 1957, the 10 largest stocks in the S&P 500 have underperformed an equal-weighted index of the remaining 490 stocks by 2.4% per year. But the last decade has been a very notable departure from that trend, with the largest 10 outperforming by a massive 4.9% per year on average.
Magnificent and concentrated
The break in the consistent downward trend of cap-weighted underperformance reflects the magnificence of the Magnificent Seven. 7 As far as mega caps go, they have been practically unparalleled in their outperformance. They strung together a series of market-beating performances over the last 10 years, with 2022 being the single year in which they didn’t beat the market. In 2023, as their monicker became part of the common lexicon, they outperformed the S&P 500 by an almost unimaginable 60%.
Exhibit 3: the Magnificent 7 vs. the S&P 500
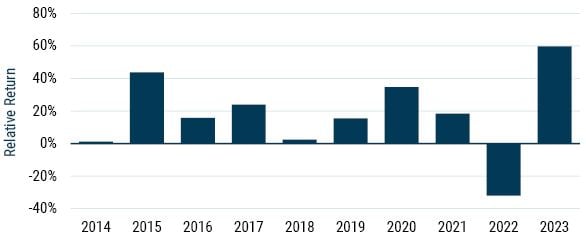
Data from 2014-2023 | Source: Compustat, Standard & Poors
This performance came in part from the unusual cheapness of mega caps at the start of the decade. Apple, Microsoft, and Google, for instance, boasted a combined price-to-earnings (P/E) ratio of 15x in 2013, while the market’s P/E was about 25% higher. A simple reversal of this trend was a lovely tailwind (although much more than a reversal occurred). These companies, alongside their similarly magnificent brethren, also managed to grow earnings at a breakneck pace. Microsoft and Amazon did so by reinventing themselves. Apple, Alphabet, Meta, Nvidia, and Tesla took over their primary industries. The medium-sized businesses among them became huge, and the large ones became giants.
The continued, unrelenting outperformance of very large companies has led to the S&P 500 becoming significantly more concentrated over the decade. The top seven names in the index comprise 28%, up from 13% a decade earlier. The S&P 500’s total concentration, which we can measure using a Herfindahl-Hirschman Index (or HHI), is equivalent today to that of an equal-weighted, 59-stock portfolio. Ten years ago, the index was more than twice as diversified. We have never seen – over any 10-year period – a decline (or increase) in diversification of the magnitude we have just witnessed.
Exhibit 4: Effective # of Names (1/HHI) in the S&P 500
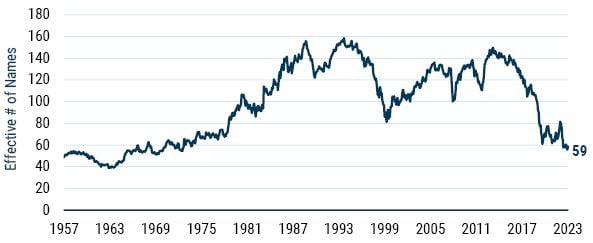
Data from 1957-2023 | Source: Compustat, Standard & Poors
The active horror show
This extraordinary performance of the mega caps and the consequent concentration of the S&P 500 seems to have become conflated with markets becoming more efficient. This conflation occurs because over the same decade that appended “Magnificent” to “Seven,” only 9.8% of U.S. large cap “core” active managers outperformed their benchmarks. 8 While these events are certainly connected, they in fact have very little bearing on market efficiency (a topic which we plan to broach in our next Quarterly Letter).
Because the vast majority of active managers are substantially underweight the largest stocks, periods when those stocks outperform are a serious headwind for active managers’ relative performance. If we contrast the equal-weighted vs. cap-weighted performance of the S&P 500 with the annual percentage of U.S. large cap core active managers outperforming their benchmark from 2014 to 2022 (according to Morningstar), we find that the correlation of these (admittedly short) two series is north of 50%.
While Morningstar has not yet published its results for the full year of 2023, the equal-weighted S&P 500 trailing its cap-weighted counterpart by 11.5% (the second worst showing of all time) suggests that investment committees will have their brows furrowed when reviewing their U.S. active equity portfolios’ performance vs. the S&P 500 over the last year. Some brow-unfurrowing might be merited. High active share managers have almost no chance in a year when the giants are dominating. 9
To show just how difficult an active manager following the concentrate-and-equal-weight strategy would have it, we simulate what a talented set of managers could have achieved versus the cap-weighted benchmark. These simulated managers have a consistent hit-rate of 53%; that is, each of their stock picks has a 53% chance of beating the average stock in the S&P 500 over the 12 months following their selection. This might not seem like a great deal of prescience, but it really is. This group of managers, by picking 20 stocks and equally weighting them, would have outperformed the S&P 500 by 3% per annum from 1957 to the end of 2023, generating cumulatively for their investors six times the return of the index. They would have beat the index two thirds of the time. Their worse performance as a group through 2023 would have yielded them a relative return of -13.6% in 1998. 10 This is a pretty exceptional return profile.
Exhibit 5: Oracle Managers vs. S&P 500
Source: GMO, Standard & Poors
The 10 years ending in 2023 were less kind to our oracular stock pickers. Despite exceptional relative returns of 8% in 2022, the group still lost to the S&P 500 by 30 bps per annum (before fees!). In 2023, only 7% of our simulated skilled managers would have beat the cap-weighted index. An investment committee that sought out fundamental managers that roughly follow our described investment process is then exceedingly unlikely to have seen its listed equity bucket shoot the lights out, and it should be comfortable with that. The reality is that these managers still had strong performance against the equal-weighted S&P 500 – and that is what they should be contrasted with in good times and in bad. If your fundamental active manager keeps lagging versus the equal-weighted S&P 500, that is suggestive of an issue; lagging the cap-weighted benchmark is, for such managers, generally uninformative.
Exhibit 6: 2023 Performance – Oracle Active Managers
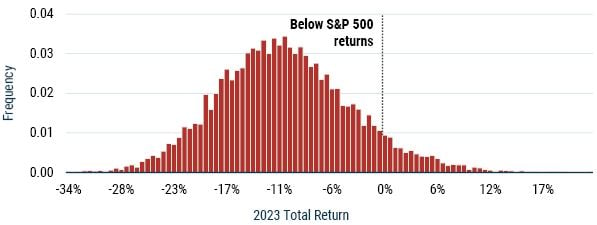
Source: GMO
A note to the investment committee
Diligent investing requires measurement, and measurement requires appropriate benchmarks. Market capitalization-weighted benchmarks such as the S&P 500 have a number of useful features. They require relatively little trading, so their performance reasonably matches that of an actual portfolio managed to track them. They encompass the opportunity set for investors as a whole – all investors could simultaneously hold a market capitalization-weighted index of global stocks. But they aren’t perfect.
As we have detailed, the cap-weighted S&P 500 is a rather awkward index today; it looks like a 70/30 split of a regular index with 493 companies and seven enormous, often expensive businesses. The top seven are no longer cheap in aggregate, boasting a P/E of 37x (vs. the market’s 25x). One reason to want to own them, however, is their quality; these companies have very deep moats. It’s hard to compete with Apple on brand value, and it’s harder still not to have the company benefit from anyone’s success in its App Store. Alphabet and Meta are the two unassailable names in advertising, and they have both been extremely successful in acquiring potential competition. Amazon and Microsoft have essentially duopolized cloud infrastructure. They have also been successful in monopolizing many a subindustry. Nvidia has repeatedly outclassed AMD and become the world’s main GPU manufacturer at the convenient moment when GPU demand has exploded due to advances in AI. And Tesla…makes pretty cool cars. Less of a moat, and a spicy valuation, but that’s beside the point. Six of the Magnificent Seven are high-quality businesses and deserve to trade at a premium.
Their premium is stretched, though. Even at their quality, this level of expensiveness normally represents a 2% drag for the companies that carry it; a cost that cheaper high-quality companies in the S&P 500 don’t have. A diversified basket of high-quality names also has less idiosyncratic risk. The proportion of stock-specific risk in a portfolio is roughly proportional to its total concentration, and the S&P 500 is therefore in the uncomfortable position of suddenly having individual lawsuits, factory strikes, and CEO changes driving a not unsubstantial portion of its return variation.
Common risks across the Magnificent Seven should also be a source of unease. They are all reliant on the general availability of semiconductors, most of them have considerable investments in AI, four of them have ties to Foxconn, and their average revenue exposure to China and Taiwan is close to 20%. A geopolitical event that hurts U.S. companies’ access to China, Taiwan, and the semiconductor industry would therefore be profoundly uncomfortable for this group of companies. Investors who are averse to the 4% combined weight of China and Taiwan in MSCI ACWI should be mindful of the 17% combined weight of the U.S. superstars in that same index.
Time will tell if the Magnificent Seven turn out to be as fallible as the Nifty Fifty or the TMT darlings that preceded them at other notable times of mega cap outperformance, but the history of mega caps when they are trading at a substantial premium to the rest of the market is particularly poor. If the U.S. equity market becomes less concentrated – our bet for the next decade – skilled active managers are poised to have a decade for the books. Allocators who stick to basics, reminding themselves of the virtues of diversification, stand to benefit handsomely.
Appendix - Equity Extension Strategies
Getting the biases you want and not those you don’t
The problem for active managers facing a concentrated benchmark is a vexing one. If they focus only on the stocks they like and ignore those they don’t, they will wind up taking a massive bet against most or all those stocks that are large weights in their benchmark. If they choose to mitigate that stock-specific risk by controlling the size of those underweights, they dilute their active portfolio, compromising the amount of outperformance they can expect to deliver. There is no obvious way out of that dilemma in a long-only portfolio, but that doesn’t mean there is no way out for a portfolio that acts like a long equity portfolio. Equity extension strategies involve building a 100% net long equity portfolio by pairing a levered long portfolio with a short portfolio – 130% long/30% short is the best-known variety, but 150%/50%, 170%/70%, and even higher leverage versions are not uncommon and can have meaningful advantages.
The primary virtue of equity extension strategies is that they allow managers to align their active positions more perfectly with their equity views rather than have their underweights driven overwhelmingly by the benchmark weight of those stocks that they do not like. To take a simple example: If a long only manager has no view on Apple, they can choose not to own it (at which point they have a -7% bet relative to the S&P 500) or choose to own approximately 7% (a 0% active weight) in deference to the fact that they have no view. If they do the former, Apple will be one of their largest sources of stock-specific risk relative to their benchmark, despite the fact that it is not a stock they have high conviction on. If they do the latter, they have spent 7% of their portfolio on a stock they have no view on, which is 7% of the portfolio that they cannot use to own stocks they believe will outperform.
On the other hand, if the manager had a significantly negative view on, say, Hewlett Packard 11 (to take an example from the middle of the pack of the S&P 500’s size rank 12 ), their ability to bet against the company is constrained to a 0.06% underweight given its weight in the index. While HP is obviously a much smaller company than Apple, at a $29 billion market capitalization it is certainly big enough for an active manager to hold a meaningful long or short position should they want to do so. But for long-only managers, HP is one of a very long list of S&P 500 companies in which they can take a significantly positive active weight vs. the benchmark should they so desire, but they are extremely constrained on the negative active weight side. This fact creates a strong bias for the vast majority of active managers to find themselves underweight the very largest stocks, irrespective of their view (or lack thereof) on the attractiveness of larger stocks vs. smaller ones.
In principle, active managers should want to control their overall tracking error to their benchmark, their stock-specific risk, and their active share independently – acting to (1) maximize their active share (and expected alpha) while (2) controlling their tracking error to be within acceptable levels and (3) scaling their stock-specific risk to the strength of their conviction on each stock. In reality, this is an impossible trinity to manage optimally in a long-only portfolio. 13
An equity extension strategy allows for better separation of the decisions. While low tracking error and high expected alpha are inherently conflicting goals, by allowing underweights to be driven by the manager’s view of what is unattractive instead of what is large, the portfolio is a more faithful representation of the manager’s views and allows them to meaningfully express their dislike for a much wider array of companies than would otherwise be possible. For a manager with talent, this should lead to a better information ratio, and for any manager, it allows their portfolio to be a more faithful representation of their views.
Equity extension portfolios are particularly handy for managers who focus on factor investing. Their goal is to invest in a characteristic and to diversify away from stock-specific traits. When benchmarked to cap-weighted indices, this is very hard to achieve: to access a desirable characteristic, tracking-error-aware factor investors are forced to take company-specific risk despite having no company-specific edge. In concentrated markets, this problem compounds, as both overweights and underweights to mega caps tend to drive a substantial part of a factor portfolio’s tracking error to the overall market. The graphic below shows the weights of the Magnificent Seven in the MSCI U.S. Value and Growth Indices (the charts would look basically identical for the Russell or Standard & Poors versions of value and growth).
Exhibit 7: The Magnificent 7 vs. Everything Else
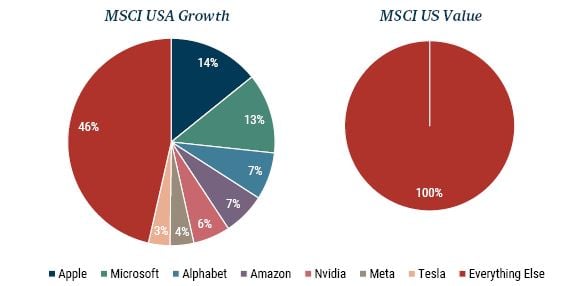
Data as of 12/31/2023 | Source: MSCI
An investor who wants exposure to the U.S. market and a strong style bet today is forced to either take a huge amount of stock-specific risk for or against the Magnificent Seven, or layer a diversified long/short portfolio with their desired style bias on top of index-like equity exposure in an equity extension strategy. There is no other choice. 14
Even looking beyond the specific problems of today’s index concentration, extension portfolios can give access to interesting factor exposures that are impossible to achieve in a long-only portfolio. For GMO’s 175% long/75% short Quality Spectrum Strategy, for example, the short side allows us to have a much more significant bet against low-quality companies than would otherwise be possible. While those low-quality stocks are not a huge part of the market, they have a history of not only underperforming in the long run, but particularly underperforming in difficult economic and market circumstances. 15 In Quality Spectrum, we can take advantage of that to build a portfolio that we believe gives a similar long-term return profile to the overall stock market with much less downside risk in very bad economic times.
Equity extension portfolios are not a panacea, however. First and foremost, even if they are a more faithful representation of an investment manager’s strongly held views, that does nothing to ensure that those views are the right ones. The simple truth of active management is that the net alpha of all holders of stocks that do not hold the capitalization-weighted sum of the market is negative after transaction costs and fees. This will still be true in an environment where the stock market is drastically inefficient. The underperformance might be concentrated in the portfolios of unsophisticated investors or investors who are not profit maximizers, but the total dollars of underperformance is inevitably greater than the total dollars of outperformance extracted for investors by outperforming managers. Beyond that fact, there are undoubtedly talented stock pickers who are not well suited to running an equity extension strategy — shorting introduces elements such as borrowing costs, volatility drag, and gamma squeezes that long-only managers don’t naturally have to worry about.
The timing of the great burst of interest in equity extension strategies in the mid 2000’s was also somewhat unfortunate. Active managers had just enjoyed a huge burst of strong performance driven by the very poor performance of the mega caps (the equal-weighted S&P 500 beat the capitalization-weighted S&P 500 by a stunning 11.8% per year compounded for the five years ending June 2005). This engendered a level of overconfidence on the part of active managers that was perhaps unmatched in history. Those halcyon days were to be shortly followed by the Global Financial Crisis, a time when regulations around shorting (including outright short bans) were as volatile as the overall market, making implementation expertise a critical skill just in time for a wide array of managers without much experience managing levered and long/short portfolios to attempt running them.
Whether the timing for equity extension portfolios is particularly propitious today is a hard call to make. The U.S. equity market is more concentrated than it has been in a half-century, and this concentration is a significant problem for long-only active managers. For investors who are interested in active management or simply taking significant factor bets but do not want to have a massive bet against mega cap stocks, equity extension portfolios are an excellent solution. Equity extension strategies are a more faithful representation of a manager’s views than can be achieved in a long-only portfolio, 16 and they are arguably the only active portfolios for which a capitalization-weighted benchmark can be the truly correct measuring stick. At the same time, after a decade of extremely good performance by the mega caps, the inevitable anti-mega-cap bias of most active long-only managers is likely poised to be a tailwind again. The rebound in relative performance for long-only active managers that would follow such a shift wouldn’t be strictly deserved – any more than they actually deserve blame for their failure to keep up with the cap-weighted S&P 500 over the last decade – but it will presumably be welcomed by their clients anyway.
Download article here.
GMO's Quality and U.S. Equity Strategies outperformed by +1.1% and +2.3% on a net basis vs. the S&P 500 and S&P Composite 1500 Indexes, respectively, for the 3-year period ended 12/31/2023.
Active share measures a portfolio’s difference from a benchmark by envisioning the portfolio as a long/short portfolio on top of that benchmark. The active share is the notional size of that long/short portfolio (1/2 the size of the longs plus the shorts). See How Active Is Your Fund Manager? A New Measure That Predicts Performance (Cremers and Petajisto 2009).
A big part of the charm of long/short and equity extension strategies is that managers are freed from this constraint. Once zero ceases to be the lower bound of portfolio weights, a manager can scale their active positions according to their conviction, not a company’s size.
If a manager has only 5% overlap with their benchmark, they definitionally have large underweights in either all or almost all stocks that have a large weight in the benchmark.
This isn’t to say that investing in the second largest company in the index is a good idea. Prior to 2013 the second largest stock was in the throes of a 20-year drawdown relative to the S&P 500.
We can see this from a regression of returns on four important factors: market, size, value, and quality. The top seven have historically underperformed what we would expect given these characteristics.
According to Morningstar’s 2023 mid-year Active/Passive barometer. Their “core” category (managers who skew neither toward value nor growth) is called “blend” on their data.
On the other hand, the legend of the ultra-high active share manager might well have been overhyped to begin with. Cremers and Petajisto noted that such managers substantially outperformed their benchmarks in their dataset, which ran from 1980-2003. During that period the equal-weighted S&P 500 outperformed the market capitalization-weighted version by 1.9%, substantially more than the 1.1% outperformance of those high active share managers. While it is unclear how many of those managers were actually benchmarked to the S&P 500 or a broadly equivalent large cap benchmark, it was certainly a propitious time to have had a bias against the very largest stocks, which the high active share managers surely did.
A year so horrible for most active investors that it is best suppressed.
To be clear, I have nothing whatsoever against Hewlett Packard as a company. The name was chosen by virtue of the fact that when writing this, I could see the HP laptop I was working on sitting next to the Apple iPhone that was charging next to it.
HP Inc. ranks 289 out of the 500 members of the S&P 500 by index weight.
OK, strictly speaking they can be managed optimally, in the sense that you can optimize a portfolio relative to an arbitrarily complex utility function. But the long-only constraint makes the solutions significantly inferior to what could be achieved if you removed the long-only constraint.
This assumes that “exposure to the U.S. market” means exposure to the capitalization-weighted version of the market. If an investor was prepared to think of the Magnificent Seven and other mega cap stocks as no more important than any other, more choices are available.
See The Quality Anomaly: The Weirdest Market Inefficiency in the World (December 2023) and The Quality Spectrum: Stability in an Unstable World (May 2023) for the history of this underperformance.
If an investor is truly unconcerned with performance relative to traditional benchmarks, this is less starkly true than it is for investors who care about performance on a relative basis. But in our experience, the population of investors prepared to ignore a decade of underperformance relative to the S&P 500 on the grounds that they are absolute return investors can be counted on the fingers of no hands.
Apple, Microsoft, Alphabet, Amazon, Nvidia, Meta, and Tesla.
Disclaimer: The views expressed are the views of Ben Inker and John Pease through the period ending February 2024, and are subject to change at any time based on market and other conditions. This is not an offer or solicitation for the purchase or sale of any security and should not be construed as such. References to specific securities and issuers are for illustrative purposes only and are not intended to be, and should not be interpreted as, recommendations to purchase or sell such securities.
Copyright © 2024 by GMO LLC. All rights reserved.
GMO's Quality and U.S. Equity Strategies outperformed by +1.1% and +2.3% on a net basis vs. the S&P 500 and S&P Composite 1500 Indexes, respectively, for the 3-year period ended 12/31/2023.
Active share measures a portfolio’s difference from a benchmark by envisioning the portfolio as a long/short portfolio on top of that benchmark. The active share is the notional size of that long/short portfolio (1/2 the size of the longs plus the shorts). See How Active Is Your Fund Manager? A New Measure That Predicts Performance (Cremers and Petajisto 2009).
A big part of the charm of long/short and equity extension strategies is that managers are freed from this constraint. Once zero ceases to be the lower bound of portfolio weights, a manager can scale their active positions according to their conviction, not a company’s size.
If a manager has only 5% overlap with their benchmark, they definitionally have large underweights in either all or almost all stocks that have a large weight in the benchmark.
This isn’t to say that investing in the second largest company in the index is a good idea. Prior to 2013 the second largest stock was in the throes of a 20-year drawdown relative to the S&P 500.
We can see this from a regression of returns on four important factors: market, size, value, and quality. The top seven have historically underperformed what we would expect given these characteristics.
According to Morningstar’s 2023 mid-year Active/Passive barometer. Their “core” category (managers who skew neither toward value nor growth) is called “blend” on their data.
On the other hand, the legend of the ultra-high active share manager might well have been overhyped to begin with. Cremers and Petajisto noted that such managers substantially outperformed their benchmarks in their dataset, which ran from 1980-2003. During that period the equal-weighted S&P 500 outperformed the market capitalization-weighted version by 1.9%, substantially more than the 1.1% outperformance of those high active share managers. While it is unclear how many of those managers were actually benchmarked to the S&P 500 or a broadly equivalent large cap benchmark, it was certainly a propitious time to have had a bias against the very largest stocks, which the high active share managers surely did.
A year so horrible for most active investors that it is best suppressed.
To be clear, I have nothing whatsoever against Hewlett Packard as a company. The name was chosen by virtue of the fact that when writing this, I could see the HP laptop I was working on sitting next to the Apple iPhone that was charging next to it.
HP Inc. ranks 289 out of the 500 members of the S&P 500 by index weight.
OK, strictly speaking they can be managed optimally, in the sense that you can optimize a portfolio relative to an arbitrarily complex utility function. But the long-only constraint makes the solutions significantly inferior to what could be achieved if you removed the long-only constraint.
This assumes that “exposure to the U.S. market” means exposure to the capitalization-weighted version of the market. If an investor was prepared to think of the Magnificent Seven and other mega cap stocks as no more important than any other, more choices are available.
See The Quality Anomaly: The Weirdest Market Inefficiency in the World (December 2023) and The Quality Spectrum: Stability in an Unstable World (May 2023) for the history of this underperformance.
If an investor is truly unconcerned with performance relative to traditional benchmarks, this is less starkly true than it is for investors who care about performance on a relative basis. But in our experience, the population of investors prepared to ignore a decade of underperformance relative to the S&P 500 on the grounds that they are absolute return investors can be counted on the fingers of no hands.
Apple, Microsoft, Alphabet, Amazon, Nvidia, Meta, and Tesla.