Executive Summary
While the first quarter of 2020 was a devastating one for total returns in emerging debt, particularly given the effects of the coronavirus (Covid-19) and the oil price war, the market corrections that have ensued now offer attractive valuation levels for both external debt and currencies within emerging markets. Emerging market stocks, bonds, and currencies have sustained major corrections comparable with the largest crises of the past 30 years. The EMBIG-Diversified index of external debt was down 13.1% amid rising credit spreads, offsetting any gains from sharply lower U.S. Treasury yields. The local debt GBI-EMGD index was down 15.2%, due mainly to poor currency returns (-13.8%), though local rates also produced losses (-1.4%).
As a result of this performance, we now find attractive valuations in both external and local currency debt. In this piece, we update our valuation charts and commentary. We are happy to provide more detail on our methodology upon request.
External Debt Valuation
Our metrics indicated that external debt valuations were getting stretched at the end of 2019, but we certainly did not expect to see what happened in the first quarter, with the multi-dimensional shock represented by Covid-19 and the oil price collapse following the breakdown of the OPEC+ agreement. The EMBIGD1 benchmark spread widened by over 300 bps, more than doubling, with virtually all this widening happening in a 4-week period between late February and late March. We have not seen a move like this since the time of the Lehman failure in 2008. Naturally, this is going to make valuations look attractive on the surface, because spreads have widened dramatically, while rating agencies are still in the process of re-evaluating ratings and our credit loss estimates are based on default probabilities from the underlying ratings.
We have tried to adjust for this dislocation in Exhibit 1 for this quarter. We present four multiples of credit-spread-to-expected-credit-loss in the exhibit. Three relate to alternative scenarios for sovereign credit ratings, and one shows the peak of the sell-off in late March, for reference. Among the former group, the highest is based on actual ratings as of March 31 (labeled “Standard”). The other two are based on pro forma ratings scenarios for the benchmark constituents that we label as “Moderate” and “Extreme.”
Our Emerging Debt team, considering the likely impact of Covid-19 and oil shocks, simulated three possible scenarios based on the likelihood of default given country’s levels of indebtedness, possible debt restructuring potential, and growth and inflation forecasts. The “Moderate” scenario assumes that the world health system gets partial control of Covid-19 in 2020 and economies begin recovery by the third, even if it is not a V-shaped recovery. It assumes about 15 of the 74 countries in the benchmark are downgraded by at least one notch, with 19 having negative outlooks. For reference, this would change the weighted average benchmark rating from BBB- to BB+. This translates into an expected annual credit loss of 122 bps, relative to the 108-bp baseline under prevailing ratings. The “Extreme” scenario assumes Covid-19 hits the emerging world hard, and oil prices and global aggregate demand remain low well into 2021. In this scenario, 62 of the 74 countries are downgraded, with nearly all current single-B countries assumed to be downgraded to CCC, based on Standard & Poor’s nomenclature. This is material since default probabilities rise disproportionately when countries enter triple-C categories, which would translate into the benchmark rating falling to BB.2 In this downside scenario, expected credit losses based on the methodology would be 184 bps on a per annum basis. This compares to 626 bps of credit spread on the benchmark as of March 31, and 635 bps at the time of writing in late April.
As Exhibit 1 shows, the “Moderate” scenario, at a multiple 5.1x (credit spread is 5.1 times the expected credit losses), is an outlier relative to the historical experience, and the “Extreme” scenario (3.4x) turns out to be roughly in line with historical averages. This suggests that, not surprisingly, the market is pricing in an extreme scenario for the future trend in credit quality. This makes sense in the risk-off context that is currently dominating the market.
Exhibit 1: EMBIG DIVERSIFIED SPREAD – MULTIPLE OF EXPECTED CREDIT LOSSES
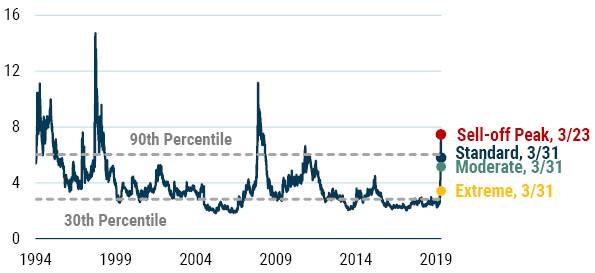
As of 3/31/20 | Source: GMO calculations based on Bloomberg and J.P. Morgan data
Debt Forgiveness and its Possible Impact on the Scenarios Above
A major ongoing initiative that may impact these scenarios is the effort to offer debt relief in the markets. While this initiative continues to be debated and negotiated, we believe it may have positive implications on emerging debt markets and the GMO portfolio, relative to the likely baseline without the support. Many of the poorest countries in the EM world have limited resources and health care capacity to deal with Covid-19. The debt relief offered by these official creditors will open up fiscal space for countries to redirect tax revenue to dealing with Covid-19, while increasing the likelihood that the countries will remain current on bond debt owed to us. While this may seem unfair, it is much more difficult and time-consuming and expensive (legal fees, etc.) to ask for blanket debt relief from thousands of different bondholders, each with varying objectives, all around the world. Thus, we believe this debt relief initiative might forestall some sovereign defaults among the weaker countries that may otherwise have occurred in its absence.
Naturally, there is a cost to blanket debt forgiveness. We are monitoring the risk of more calls for debt relief and debt moratorium if the crisis continues to last longer than expected. We also consider that in the future, this willingness of official sector creditors to offer this debt relief may reinforce their claim to being “senior” creditors in future debt restructurings. They could then argue that because they gave debt relief during the great 2020 pandemic, they need to give less debt relief in the future, putting more onus on bondholders. However, for now, this debt relief is welcomed by the countries and good news for bondholders.
The debt relief applies to the poor countries that are currently eligible for concessional financing from the official sector. Several of these countries have issued bonds in international markets, which GMO funds have purchased. Many of the countries are in sub-Saharan Africa, such as Ivory Coast, Cameroon, Republic of Congo, Ghana, Nigeria, and Ethiopia. However, there are others as well, such as Mongolia, Pakistan, and Tajikistan.
Liquidity
One key feature of emerging markets is liquidity and GMO’s external debt portfolio benefits from and takes exposure to the liquidity premium in emerging markets. Emerging market debt is a risk asset and bid-ask spreads typically widen in times of crisis. As Exhibit 2 shows, bid-ask spreads maintained an average of 0.6% during the prior year before widening to a high of 2.2% on March 23. Bid-ask spreads came in by nearly 30 bps during the final few days of the month, ending the quarter at 1.9%.
Exhibit 2: EMBIG-D Bid-Ask Spread (% of price), March 2019 – March 2020
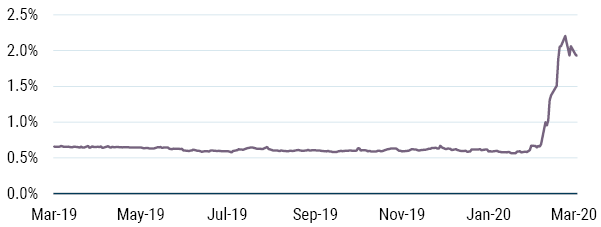
As of 3/31/20 | Source: GMO, Haver, J.P. Morgan
It is important to note that bid-ask spreads tend to revert to a standard level (historically, 0.8%) after widening during times of crisis, and this time appears to be no different. In Exhibit 3 we see how bid-ask spreads behaved during such crises as the Mexican peso crisis (1995), Russian financial crisis (1998), and the Global Financial Crisis (2008), and their following stabilization. From the pinnacle of the Mexican peso crisis in January 1995, it took roughly 6 months before bid-ask spreads stabilized, and roughly 1 year for bid-ask spreads to stabilize following the Russian financial crisis and the Global Financial Crisis.
We believe that the stabilization of bid-ask spreads following the impact of the Covid-19 pandemic and oil shocks will be quicker relative to prior crises. Our strategy focuses on instrument selection and tends to own securities with a lower liquidity profile than the benchmark. We are long-term-oriented investors and liquidity providers in this type of market, and our process can identify dislocations and opportunities to pick up attractively priced securities from forced sellers. We believe this approach positions us well for alpha versus the benchmark going forward.
Exhibit 3: EMBIG-D Bid-Ask Spread (% of price), Since December 1993
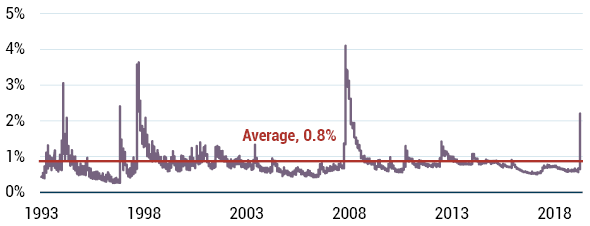
As of 3/31/20 | Source: GMO, Haver, J.P. Morgan
Local Debt Markets Valuation
Below we extend the discussion to local markets. Exhibit 4 provides a snapshot of our currency valuation methodology. The underlying model analyzes trends in macroeconomic fundamentals such as balance of payments composition and flows, valuation of the currency, and the economic cycle, and uses a regression analysis to produce an estimate of total expected FX returns for each country in the GBI-EMGD benchmark. These are then combined into a single value of a total expected FX return using a market cap weighted average of currencies in the GBI-EMGD. We then deduct the GBI-EMGD weighted carry from the estimated GBI-EMGD weighted value of total FX expected return to get to an expected EM FX spot return. Finally, we estimate a neutral range based on the backtest of the overall model to assess whether EM currencies are cheap, rich, or fairly valued. A value that is higher (lower) than the upper (lower) value of the neutral range could potentially indicate “cheap” (“rich”) currencies. A value that is within the neutral range would be considered “fair.” Based on our framework, EM currencies are attractively valued relative to the past 5-year average, and close to the peak reached during the 2008 financial crisis.
Exhibit 4: GBI-EMGD Expected Spot FX Return Given the Fundamentals
As of 3/31/20 | Source: GMO
Note: The values shown above apply the GBI-EMGD weights to the emerging currencies.
The expectations provided above are based upon the reasonable beliefs of the Emerging Country Debt team and are not a guarantee. Expectations speak only as of the date they are made, and GMO assumes no duty to and does not undertake to update such expectations. Expectations are subject to numerous assumptions, risks, and uncertainties, which change over time. Actual results may differ materially from those anticipated in the expectations above.
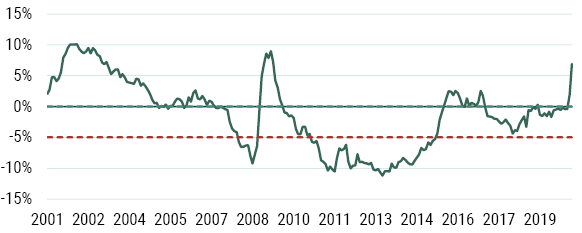
As for EM local interest rates, we consider differentials in real yields to gauge the relative attractiveness of EM against Developed markets (see Exhibit 5). In this regard, the story that has been in place for many quarters (years, actually) remains as we can still see a substantial positive gap between EM and Developed market real yields. That gap increased during the first quarter as emerging real yields rose by 31 bps to 2.25% from 1.94%. The rise in real yields came from a sell-off in the nominal yields of higher-yielding countries on the back of the oil and growth shocks while inflation forecasts came down in most EM countries as global demand is expected to fall dramatically. The spread between EM and U.S. real yields widened during the quarter, to 321 bps. While this spread had been fairly stable for several years running, the 5-year average of this spread rose to 214 bps from 207 bps at the end of Q4. By our calculations, the real yield in the U.S. fell to -1.0% in March from 0.0% in December, while Japanese and European real yields remained firmly in negative territory.
Exhibit 5: GBI-EMGD Weighted Average Inflation-Adjusted Bond Yield Vs. G3
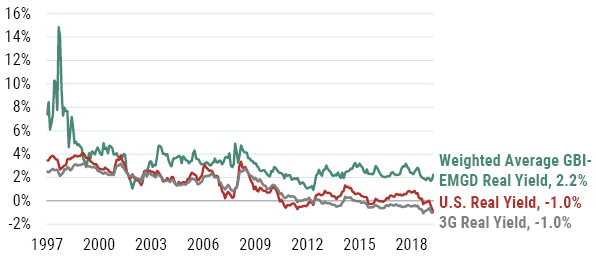
As of 3/31/20 | Source: GMO
Note: Real yields are measured using the country subindices of the GBI-EMD and GBI Global, respectively, less Consensus Forecast CPI
Acknowledgement: The authors would like to thank Kim Sullivan for her contributions to this paper.
Download article here.