Executive Summary
The emergence of State-owned Enterprise (SOE) borrowing in international capital markets has been notable in the last decade. Since the Global Financial Crisis, SOEs have sought to diversify their funding away from local banks. As a result, SOEs, or quasi-sovereigns as they are often known to fixed income investors, now make up roughly half the opportunity sets in both the emerging sovereign debt and emerging corporate debt investment universes. Credit investing of any kind typically offers investors compensation for expected default losses. In addition, structural mispricing often results in a boost to the risk premium. In this paper we argue that the very structure of SOE debt results in a consistent additional risk premium that long-term investors should find attractive. We believe SOEs have consistently overpaid for realized idiosyncratic default risk to date. Further, we believe there are structural reasons that drive the chronic overestimation of SOE default risk, which in turn leads to mispricing and opportunity. In addition, we believe GMO, as a long-term investor in this space with its first SOE debt investment in 1994, has several structural strengths geared to help generate sustainable excess SOE debt returns.
The Emergence of SOE Debt: Why Does It Even Exist?
The great majority of SOE funding is domestically sourced by local banks.1 However, within the past decade, SOEs have chosen to diversify their funding sources by venturing into the international capital markets. As a result, SOE debt has become a significant part of the emerging sovereign and emerging corporate debt investment universes (See Exhibit 1).2 The determinant as to whether SOE debt will enter the sovereign or corporate index is its ownership. Those entities that are 100% government-owned go into the sovereign index and the rest find a home in the corporate benchmark. This is, of course, a largely arbitrary construct instituted by index providers and driven by legacy reasons.3
EXHIBIT 1: SOE DEBT IS A BIG COMPONENT OF BOTH EMERGING SOVEREIGN AND CORPORATE DEBT INDICES
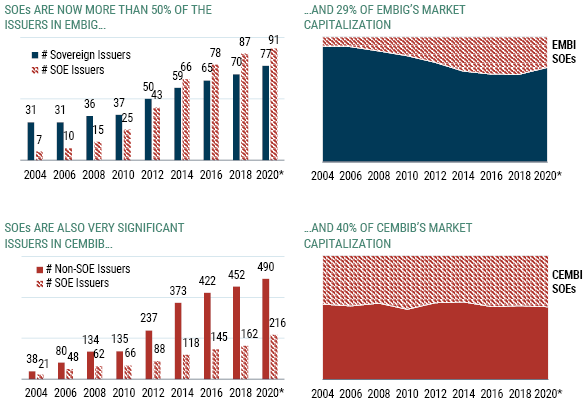
*As of 7/31/20 | Source: J.P. Morgan, GMO
So, why wouldn’t SOE shareholders, or governments, borrow directly to on-lend to SOEs, thereby bypassing the inflated SOE default risk premium? On the surface, EM sovereign and SOE borrowers could collectively slash their interest bill by roughly 30 basis points of their collective GDPs.4 Why don’t governments do just this? Let us walk you through some of these reasons.
First, the Government Finance Statistics manual, which lays out the IMF’s accounting rules, incentivizes governments to keep SOEs a going-concern and have them borrow on their own. When an SOE deemed viable – and a great majority are – borrows, the SOE’s senior unsecured debt will not be reported as a contingent liability on a shareholding government’s balance sheet. This omission flatters a sovereign’s fundamental credit ratios. Better ratios, of course, lead to better public ratings, which ultimately lead to cheaper sources of sovereign financing. The key here is that an SOE needs to be a going-concern, which can be subjective in some corner cases.5 We estimate that if a typical SOE debt issuing EM country in the EMBI index were to take all SOE outstanding debt onto its own balance sheet, the debt to GDP ratio would increase by 15 points to 60%.6 By not doing so, we estimate a sovereign typically saves roughly 0.8% of GDP, a hefty number compared to the roughly 2.4% average interest to GDP ratio, thus leaving it with a much stronger credit profile.7 An added benefit, from the government’s perspective, is that SOE debt issuance tends not to be governed by the same mechanisms that govern the stricter sovereign issuance, hence requiring no parliamentary approval.
Second, compelling economic rationale exists for a sovereign to let its SOE borrow on its own. As equity investors, sovereigns are incentivized to take on debt to boost their returns on equity. Contrast this with a government on-lending where this related-party transaction is most likely registered as an acquisition of non-financial assets in the same amount (the government will substitute borrowed cash for an increase in investments in the same amount). To better illustrate, let’s consider a fictional commodity producer’s credit ratios from the sovereign’s perspective8 in the following two scenarios:
- In Scenario A, the SOE has no debt and is 100% funded by the sovereign.
- In Scenario B, the SOE is only partially funded with sovereign equity, borrowing the rest on a stand-alone basis, up to “simple” leverage of 5x. Further assume the sovereign receives a 100% dividend payout.9
In this example, the sovereign in Scenario A will have a marginal gain of 8% and marginal cost of 6%, pocketing 200 basis points. The sovereign in Scenario B, on the other hand, will have a marginal cost of 5% and marginal gain of 12%, pocketing 700 basis points. The difference can be explained by the following two reasons. First, the sovereign in Scenario B, having offloaded SOE debt from its balance sheet and thus improved its own credit ratios, enjoys a lower interest rate on its entire sovereign debt stock. Second, debt sitting on the SOE’s balance sheet provides financial leverage for the shareholding sovereign, which then increases ROE by 50% from 8% as in the Scenario A case (see Exhibit 2).10 It is important to note that Scenario B only works so long as financial leverage on SOE balance sheets remain sustainable, which is the case most of the time.
EXHIBIT 2: HIGHER SOE LEVERAGE LEADS TO HIGHER GOVERNMENT RETURNS
Sovereign Return on SOE Equity
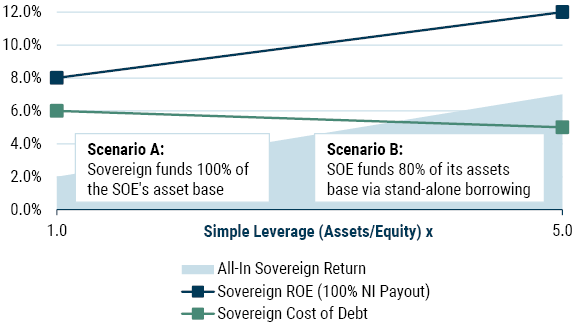
Source: GMO
Third, the international best practices of SOE corporate governance, offered by the World Bank and IMF, seek enhanced financial and fiscal SOE discipline to maintain sectoral government fairness while eliminating anti-competitive behavior. These practices provide an overarching framework for an independent SOE management along with a Board of Directors to strengthen corporate governance.
The Investment Case: SOE Debt Has Been a Solid Investment
Credit investing of any kind typically offers investors compensation for expected default losses. To date, we have found that SOEs have consistently overpaid for realized idiosyncratic default risk.11 In the past decade, investors on average collected 120 basis points in annual SOE credit premium with the expectation that future defaults would eat away about 6 basis points.12 In reality, default activity subtracted just 1 basis point, resulting in a robust total return of 5.6% per annum.13 This is an incremental loss multiple (spread collected/loss experienced) of 120x! For comparison, the sovereign credits in EMBIG trade at around 3.4x today, which is already an attractive level for investors. Exhibit 3 shows SOE debt currently offers about 200 basis points of SOE credit premium, in addition to offering 160 basis points for the sovereign credit premium and 50 basis points of U.S. Treasury yield. Exhibit 4 displays the empirical SOE credit premium’s risk/return within EMBI Global Diversified (EMBIG-D), the sovereign debt benchmark against which GMO Emerging Debt strategies are measured.
EXHIBIT 3: ANATOMY OF SOE DEBT WITHIN EMBI GLOBAL DIVERSIFIED – CURRENT VALUATIONS
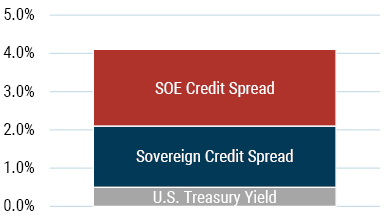
As of 7/31/20 | Source: J.P. Morgan, GMO
Exhibit 4: Historical SOE Credit Spread Risk/Return in EMBIG-Div
As of 7/31/20 | Source: J.P. Morgan, S&P, GMO
Note: Duration adjusted spread over the sovereign in the EMBIG-Div with renormalized weights. Expected credit loss is calculated based on the public rating differentials between quasi-sovereigns and sovereigns. Default probabilities extracted from the S&P global sovereign rating transition matrix. Recovery assumption of 25% for both sovereigns and SOEs.
There are several reasons for such low idiosyncratic expected losses, which are derived from default probability differentials between a sovereign and its SOEs and can be gleaned from public ratings. As Exhibit 5 shows, roughly 90% of EMBIG SOEs are rated the same as their sovereign by the public rating agencies, implying virtually no incremental default probability between the SOE and its sovereign. While there is some disagreement between the SOE and sovereign ratings, the great majority of these are concentrated in the investment grade segment of the index where the default probability differentials are not meaningful. For example, when a credit moves from AA to A, the default risk only slightly nudges up.
EXHIBIT 5: SOE DEBT TENDS TO HAVE THE SAME RATING AS ITS SOVEREIGN, AND SOVEREIGNS TEND TO BE RATED INVESTMENT GRADE
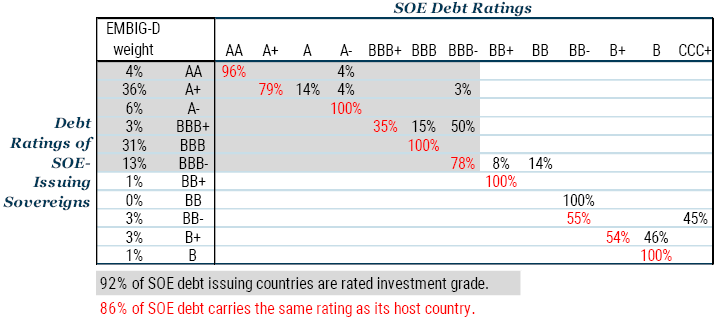
As of 7/31/20 | Source: J.P. Morgan, S&P, Moody’s, GMO
So, what explains even lower actual losses? Governments are not contractually obligated to pay back SOE debt. But SOE defaults, idiosyncratic or otherwise, have been rare. When one does occur, recoveries relative to the sovereign have been high, explaining the 1-basis-point loss mentioned earlier.14 We offer three explanations as to why defaults have been so rare to date. First, a great majority of SOEs have the means to pay back the debt on their own. Second, about half of all SOE debt is akin to policy-oriented agency debt like that of Fannie Mae and Freddy Mac in the U.S. From a policy perspective, national goals are so intertwined with policy-oriented SOE missions, governments view bailouts to be more cost-effective than defaults. Third, SOE debt-issuing emerging governments place a high value on maintaining a clean, default-free record: they worry about the reputational damage that may cause negative knock-on social, financial, or political impacts, even in the case of commercially-oriented SOEs.
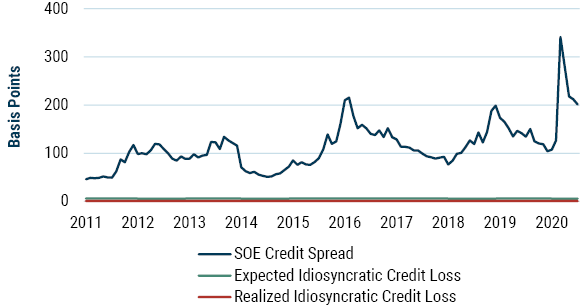
If both expected and actual permanent losses are rounding errors, why then are such high spreads offered by the market? We can cite a couple of technical reasons. First, SOE issues have inferior liquidity relative to sovereign issues. For example, the average bid-ask spread in EMBI’s sovereign debt bonds was 80 basis points over the last decade, whereas the spread for SOE debt in EMBI was higher at 86 basis points. The second reason may be due to the market’s rather uneven pricing of idiosyncratic SOE default risk. During risk-off periods, SOE bond spreads tend to widen (bond prices fall), and conversely narrow in better times. Exhibit 6 shows this relationship over time. To be sure, as credit spreads widen, temporary losses are experienced by debt investors. Importantly, though, as markets normalize and fewer or no defaults occur than those that have already been priced in, such temporary losses reverse. For long-term investors, we argue the most important risk factor is not the temporary mark-to-market events, but the possibility of the permanent impairment of capital.
EXHIBIT 6: SOE DEBT TOTAL RETURN BETAS ARE UNEVEN RELATIVE TO SOVEREIGNS
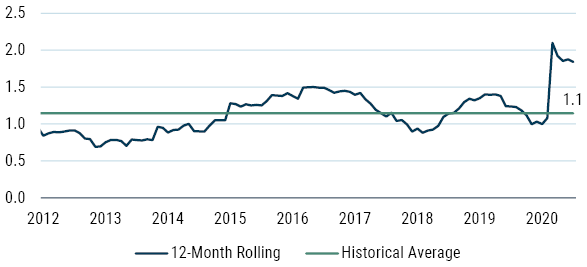
As of 7/31/20 | Source: J.P. Morgan, GMO
Beyond the specific performance data, we believe there are structural reasons behind both the chronic overestimation of default risk and realized outperformance. These take the form of informational asymmetries or the reputational risk to the sovereign in the event of default to name just two. While these potential risks are difficult to standardize and quantify, on balance they can lead to the overestimation, and therefore mispricing, of risk. We believe this mispricing can be uncovered and exploited through diligent security selection analysis. Our track record of consistent outperformance reflects our success.
SOE Debt and GMO’s EM Debt Portfolios
Given this excessive and persistent risk premium, we typically hold a structural SOE overweight across our external and local debt portfolios. We believe GMO’s EM Debt team has several structural strengths that contribute to the rigorous analysis of SOE debt and, ultimately, excess return. Our SOE-dedicated approach considers both traditional corporate and sovereign credit analysis toolkits, as well as factors unique to SOE analysis.
Leading our list of strengths is that SOE debt is evaluated by dedicated SOE analysts. There is little disagreement in the marketplace that sovereign debt risk and corporate debt credit risk must be assessed by experienced sovereign and corporate analysts. But what about the SOE debt that sits in between a sovereign and a corporate? As dedicated SOE analysts, we rely on a four-pillar investment process to examine SOE borrowers’ idiosyncratic default riskiness. Exhibit 7 shows the key building blocks of this process. Broadly, we select each company based on a combination of: 1) stand-alone company fundamentals (i.e., traditional corporate analysis); 2) the crucial, careful assessment of the sovereign’s willingness to pay for a bailout (which is unique to SOEs and otherwise systemically important entities); 3) the sovereign’s ability to write a bailout check (i.e., traditional sovereign analysis that is performed by our sovereign colleagues); and 4) how a particular debt instrument’s features may alter possible investment outcomes. Additionally, each of the pillars accounts for ESG factors that we have found to have the most impact on SOE credit risk. Governance has always been an integral part of our credit analysis process, and we are happily adapting to a world where Environmental and Social factors are also valued.
EXHIBIT 7: GMO’S SOE DEBT VALUATION PROCESS
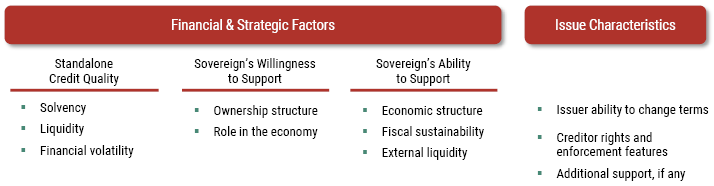
Source: GMO
Second, for larger SOE issuers with multiple issues (some issuers have 10+ bonds outstanding), we emphasize security selection to maximize total return potential while minimizing default exposure, with a focus on a long horizon and low turnover. Ultimately, we aim to earn the most spread on our portfolio of holdings relative to the benchmark in order to deliver superior total credit return regardless of whether the SOE pays its debts or defaults and restructures them. We also recognize that transaction costs in the asset class are high even in normal times and can be truly punitive in times of stress. Making careful purchases with a “buy and hold” philosophy is helpful in lessening this known source of drag on a portfolio’s performance.
Our third strength is that we have extended our investment universe to include corporate and other non-benchmarked SOEs. In addition, we also include systematically important privately-owned entities, casting the widest “opportunity net” possible. Having weathered many crises in the emerging debt markets and having witnessed the same in developed markets, we have learned that privately-owned entities can also benefit from the potential for extraordinary government support, and the markets typically misprice such possibilities.
Finally, our reputation and sourcing network are tremendous strengths. Given that GMO has been known in the industry for its focus on SOEs for more than 25 years, we get regular access to such issuers, many with whom we’ve developed direct relationships. We frequently meet15 with SOE debt issuers, often hosting SOE borrowers in our offices. Prior to Covid-19, we met with approximately 100 management teams throughout the year. After a pause earlier this year, the frequency of these meetings has increased despite travel restrictions as we have transitioned to using video and other teleconferencing technology.
Conclusion
The structure of our investable markets has evolved over time to include much more SOE debt, which now makes up roughly half the opportunity sets in both emerging sovereign and corporate debt investing universes. SOEs have consistently overpaid for realized idiosyncratic default risk to date, and we believe the structural reasons behind the chronic overestimation of SOE default risk remains unchanged. For long-term investors, this inefficiency offers an opportunity. At GMO our dedicated SOE debt effort has helped us deliver sustainable excess returns.
Download article here.