Value: If Not Now, When?
By Ben Inker and John Pease
Executive Summary
After more than a decade of disappointing performance, Value stocks just experienced their worst 12-month performance in history. This has left these stocks trading at some of the cheapest levels relative to the market we have ever seen. This cheapness is robust to a variety of challenges that skeptics may raise, and this is true broadly across all major equity regions. An analysis of the sources of returns for Value since 2007 shows that more than 100% of Value’s underperformance is due to falling relative valuations, confirming that under the surface the Value premium actually still exists. If Value were to continue trading at current spreads to the market and experienced the same relative fundamental performance as it has over the past 14 years, it would beat the market. The flip side of the extraordinary cheapness of Value is the expensiveness of Growth: we believe Growth stocks have entered a bubble similar to the one in 2000. While we are not sure what the catalyst will be for the deflation of the Growth bubble and the recovery for Value, there are a number of plausible candidates for one, not least the eventual recovery of the global economy over the next 12-18 months as the pandemic recedes. We believe the outlook for Value is exceedingly bright from here, particularly in a long/short framework, which can profit from Value’s outperformance in both rising and falling markets.
To learn more about our Equity Dislocation Strategy, read the Product Primer.
EQUITY DISLOCATION
How To Profit From A Growth Bubble
By Ben Inker
Executive Summary
The current Value opportunity is reminiscent to us of previous bubbles in global markets. In several of these we built long/short portfolios for our clients and were able to capture strong returns for them as mean reversion occurred. Earlier this fall, we launched a new one, the GMO Equity Dislocation Strategy. This strategy is long undervalued stocks and short overvalued stocks globally, and we believe it has the potential to achieve the 80+% cumulative net returns we captured for clients invested in the GMO U.S. Aggressive Long/Short Strategy during the bursting of the TMT bubble. While the portfolio is certainly long Value and short Growth, it does not look much like style indices or ETFs, which we believe have excessively large sector biases and too much stock-specific risk. We are using Equity Dislocation in the multi-asset and liquid alternatives portfolios the GMO Asset Allocation team manages. For investors who are still believers in Value, we think this strategy can be a good complement to long-only Value implementations. And even for those who no longer believe in Value for the long run, we think it would still make sense to contemplate this strategy as a hedge against the risk of cyclically poorer returns to growth-oriented public and private equity portfolios after their decade of extraordinarily good returns.
To access a PDF of this article, please contact us or your GMO representative
Value: If Not Now, When?
By Ben Inker and John Pease
It is often hard to take your mind off discomfort. The drumbeat of worry can be made louder, though, if your attempt at mental respite involves – as did mine – reading a book called Migraine.1 No matter how lyrically pain is evoked, or how well-crafted its description, it (unsurprisingly) still reminds the reader of pain. And the year is 2020. And we are Value investors.
EXHIBIT 1: U.S. VALUE'S 2007-2020 RELATIVE RETURNS
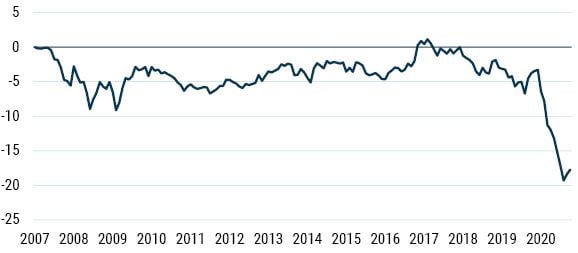
As of 9/30/2020 | Source: GMO, Bloomberg, MSCI
U.S. Value defined as the cheap half on market cap within the U.S., including financials.
The performance of Value from 2007 to 2019 was, to put it mildly, uninspiring. This was not altogether surprising, considering the run-up that Value had prior to that period. We at GMO did warn of the peril of investing in cheap stocks at a time when their valuations relative to the broad market looked to be at a record high.2 But the mind-numbing pain of holding Value anywhere in the world over the last 12 months has been something else entirely – it has shattered the record losses of the factor over any year-long period, tech bubble included. It is time, then, to repeat our message from last year, though this time more forcefully: no matter where you look, no matter how you slice it, Value looks cheap (see Exhibit 2).
EXHIBIT 2: U.S. VALUE'S RELATIVE VALUATION
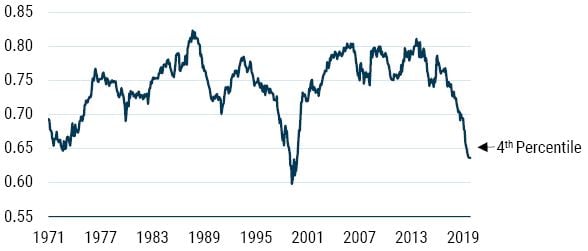
As of 9/30/2020 | Source: GMO, Worldscope, Compustat, MSCI
U.S. Value defined as the cheap half on market cap within the U.S., including financials.
Value’s Broad Attractiveness
After a very difficult 2020, U.S. Value – as GMO defines it – now trades at the fourth percentile of relative valuation on the blend of metrics that we generally use to evaluate the group’s attractiveness.3 You might object that this is a non-standard definition of Value, and if cheap stocks were chosen using some other metric they might look less interesting. To address this concern, we can analyze how attractive the cheapest half of the U.S. looks when built on 11 different metrics, including GMO’s proprietary “P/Scale” (see Exhibit 3).
EXHIBIT 3: VALUE IS CHEAP NO MATTER HOW YOU DEFINE IT
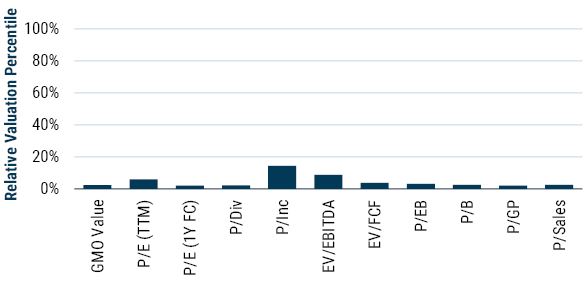
As of 9/30/2020 | Source: GMO, Worldscope, Compustat, MSCI
U.S. Value defined as the cheap half on market cap within the U.S., including financials (except for EV-based metrics).
No matter how we define cheap stocks – whether on book, or free cashflow, or forward earnings – they look attractive relative to history. Ten of the eleven definitions of Value presented are cheaper than they’ve been in at least 90% of months since 1971, with the cheap half on price to income4 the misfit. The relative valuation of this group looks a little bit less compressed at the 13th percentile, but it bears mention that in the cheapest month for U.S. Value of all time – February of 2000 – the cheap half based on this one metric was a similar outlier.
Though most definitions of Value look cheap in relative terms, we often hear concerns about this attractiveness being an artifact of the universe within which we are choosing cheap stocks. If we are simply selecting the cheapest securities within the U.S., for instance, we will today be comparing beaten-down energy companies and yield-starved banks with profitable technology behemoths. These two groups should clearly have a significant pricing discrepancy. To address this, we can use industry classification standards to select the cheapest half of companies within each sector, group, or industry, looking at the relative valuations of the cheapest companies in the U.S. when we strip out the “class” bets. No matter what we do, U.S. Value still looks exceptionally cheap (see Exhibit 4).
But Value being cheap within sectors, groups, and industries doesn’t assuage everyone’s fears. Some people worry that Value is cheap because it is picking small caps, and small caps deserve to trade at a significant discount, particularly given the disproportionately hard hit the Covid-19 shock has had on smaller companies. Exhibit 4 – again – shows us that we can select Value exclusively within large caps or exclusively within small caps and, no matter, Value still looks quite cheap.
Perhaps it isn’t about size per se, but maybe it’s about the ultra-high-quality FAANGMs being quite expensive. In the broad universe and in the large cap space, even if we industry-neutralize, this might distort our view given the massive weights that these companies have. To test this, we can exclude the FAANGMs from our fishing pool and see whether Value looks cheap relative to the ex-FAANGM market.5 It does.
EXHIBIT 4: VALUE IS CHEAP NO MATTER WHERE YOU LOOK
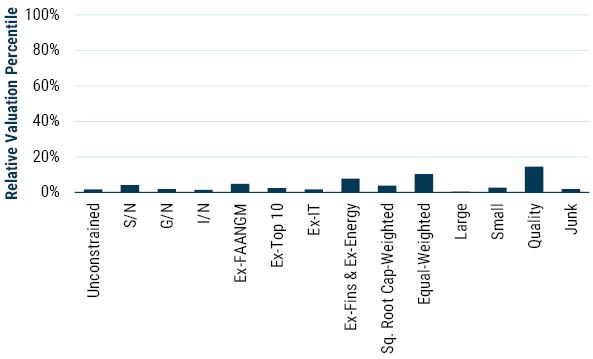
As of 9/30/2020 | Source: GMO, Worldscope, Compustat, MSCI
There are other specifications we can alter to check whether Value’s cheapness is truly robust. We can exclude IT, presumably the most expensive sector in the U.S., or we can exclude Energy and Financials, presumably the least expensive sectors in the region; we can weigh securities differently, avoiding full cap weighting where large companies are likely to drive results; we can pick Value only within the high quality or junky sections of the market. Without exception, Value – at least from a historical perspective – remains exceptionally cheap.
Though history is often a good guide, it’s important to recognize that markets can – and have – changed. Many of the high-flying companies of today are capital-light and R&D-heavy, a combination that with traditional accounting can lead to significant misreads of who is cheap and who isn’t. If this were a substantial problem, then we should see that Value looks particularly cheap within industries where there is a lot of intangible investment,6 but not in industries where “intangibility” is low. This does not seem to be the case, as can be seen in Exhibit 5.
EXHIBIT 5: VALUE IS STILL REMARKABLY CHEAP IN INDUSTRIES LOW ON INTANGIBLES
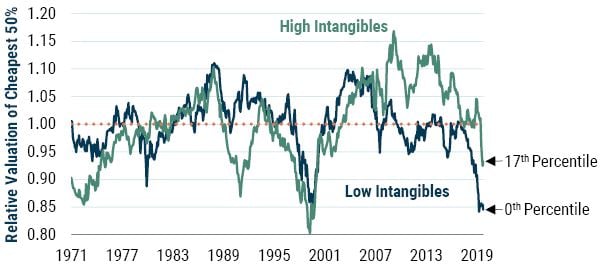
As of 9/30/20 | Source: GMO
Composite Valuation Measure is composed of price/sales, price/gross profit, price/book, and price/economic book. Universe and group both exclude Facebook, Apple, Alphabet, Amazon, Netflix, and Microsoft.
The new investment mix of companies is not the only change we have seen in markets. Over the past 20 years, anti-trust agencies have been significantly less active at the same time that advances in technology have brought about increasing returns to scale in industries where there previously were none. These two forces, sometimes separately and frequently in unison, have eroded competition and enabled the rise of so-called “Superstar Firms” – extraordinarily profitable, highly scalable, oligopolistic businesses. The corollary to industry superstars is that other companies within the same industries see their market share dwindle and their profitability crash, leading to compressed valuations for good reason. But when we look at the relationship between “profit concentration” – the gap between the profitability of the largest four companies within an industry and all their smaller competitors – and the attractiveness of cheap companies within industries, we again see no relationship (see Exhibit 6). In fact, Value looks cheaper in more competitive industries. This doesn’t mean that Value traps within industries with a dominant company don’t exist, but it does mean that low-cost companies abound even where competition is still alive and well.
EXHIBIT 6: VALUE IS ALSO CHEAP WITHIN COMPETITIVE INDUSTRIES
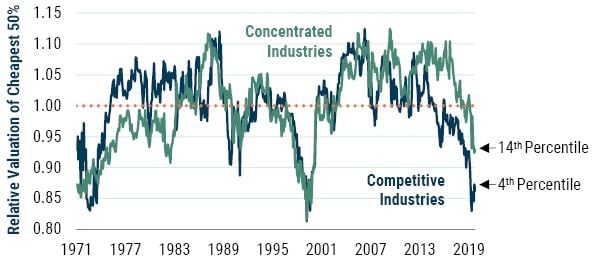
As of 9/30/20 | Source: GMO
Composite Valuation Measure is composed of price/sales, price/gross profit, price/book, and price/economic book. Universe and group both exclude Facebook, Apple, Alphabet, Amazon, Netflix, and Microsoft.
Value’s Prospective Returns
It’s clear that Value is very cheap in relative space, and that cheap portfolios can be formed even when we avoid industries where traditional accounting does a poor job or where monopolies are wiping out the competition. This is not enough to want to invest in Value, however, if we don’t believe that valuations have a reason to rise. In that case, we need to understand whether absent valuation changes – that is, even if Value were to remain as cheap as it is today – we should expect the factor to outperform.
It turns out that we should. We can see this by breaking out Value’s relative returns into four pieces: its fundamental undergrowth to the market, its yield advantage (due to being cheap), the profits from selling holdings that have become expensive and replacing them with cheaper securities (what we call “rebalancing”), and changes in relative valuations.7 Given that valuations cannot trend in either direction forever, it is the first three – growth, yield, and rebalancing – that determine whether Value’s structural prospects are positive or negative. And both before and after 2006, when we put those three together, we see Value outperforming the market (see Exhibit 7).
EXHIBIT 7: U.S. VALUE RELATIVE RETURN DECOMPOSITION
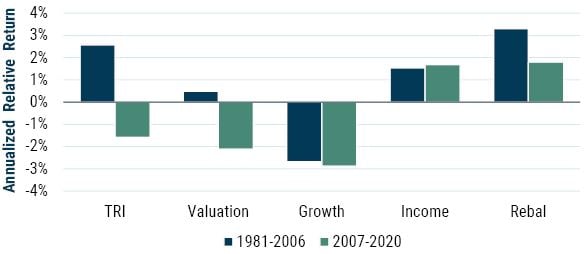
As of 9/30/2020 | Source: GMO, Worldscope, Compustat, MSCI
U.S. Value defined as the cheap half on market cap within the U.S., including financials.
We do have reason to believe that valuations will provide a tailwind to Value, however. After all, low relative valuations for cheap stocks have generally begotten higher relative valuations in the future. Though this is congruent with investors demanding a premium for holding stocks perceived to be risky, it is also the kind of phenomena we have come to expect from watching the cycle of a style performing poorly, becoming unloved, and then suddenly surprising on the upside as investors discover that their expectations, for one reason or another, were a little (or a lot) too low.
Though our emphasis up to now has been on Value within the U.S., it is important to note that internationally – both in developed and emerging markets – Value also looks like a remarkable bargain (see Exhibit 8). In many cases, in fact, we have never seen cheap stocks looking cheaper than they do today. So, if the undergrowth of U.S. Value worries you too much, or if the quality of European Value is not to your liking, or if you deem real rates in the developed world to be too low for Value to win, we believe opportunities still abound to allocate to cheap companies at remarkably cheap levels elsewhere.
EXHIBIT 8: PERCENTILE RANKING OF VALUATION SPREADS OUTSIDE OF THE U.S.
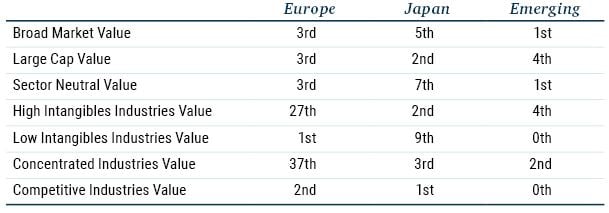
As of 9/30/2020 | Source: GMO
Value’s Cheap, Is Growth a Bubble?
If Value stocks are extremely cheap versus the market, it is necessarily the case that Growth stocks are very expensive. In absolute terms, that is even more true, given that the overall market is trading at elevated valuations relative to history. Exhibit 9 shows the median price/sales of the Growth half of the U.S. stock market, and Exhibit 10 shows their median P/E. On a price/sales basis, Growth stocks are even more expensive than they were in 2000, and while they are not quite as extreme on a P/E basis, they are certainly far more expensive than any time before or since.
EXHIBIT 9: U.S. GROWTH PRICE/SALES
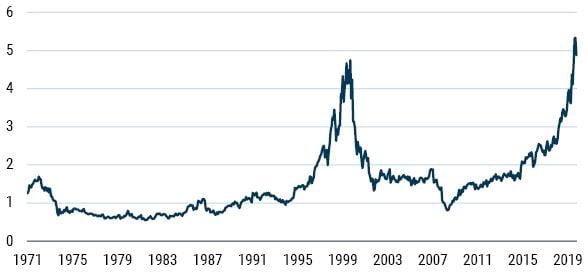
As of 9/30/2020 | Sources: GMO, Worldscope, Compustat, MSCI
Note: Valuation ratios calculated using a weighted median
EXHIBIT 10: U.S. GROWTH P/E RATIO
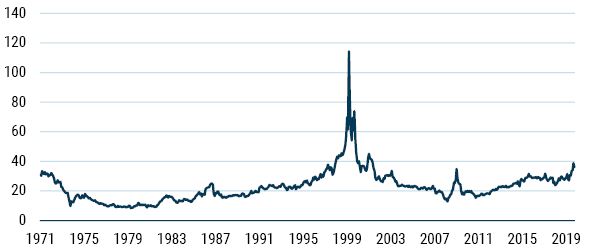
As of 9/30/2020 | Sources: GMO, Worldscope, Compustat, MSCI
Note: Valuation ratios calculated using a weighted median
At what point do you call that a bubble? While Growth stocks and the market as a whole have been quite expensive for several years now, Jeremy Grantham has frequently been at pains to remind us that there is more to an investment bubble than elevated valuations. According to him, what the true investment bubbles have in common is a mania on the part of market participants and a sense that if people would only jump on board, “Everybody Ought to be Rich.”8 A bull market that goes on and on without capturing the public imagination probably isn’t a bubble. A poor investment on a forward-looking basis, perhaps, but not a bubble. Until this year, the post-Global Financial Crisis bull market had been notable for how boring it had been. Certainly the term “FAANGs” became well-known to everyone in the investment world and many people outside of it, but compared to the frenzy for internet stocks in the late 1990s or, indeed, for flipping condos in the mid-2000s, there just didn’t seem to be the type of mania that a bubble requires.
And then 2020 happened. Perhaps it was the lockdown that left people with plenty of time on their hands and no sports to bet on, but this year has seen more crazy activity in the stock market than anything we have seen since 2000. Whether it was Hertz stock rising 10-fold in the spring as a high beta recovery play despite the fact that the company was bankrupt and shareholders wouldn’t have benefitted from a recovery even if it happened, or Kodak stock rising 30-fold after announcing it was going to start making chemicals to enable the production of Covid-19 treatments, very odd and speculative things have been going on. As a more traditionally Growth-y example, Tesla has risen some 800% since the fall of 2019 on the back of 17% growth in vehicles sold. It now has a greater market cap than the sum of all the other U.S. automakers, all the European automakers, and all the Korean automakers, with Honda, Mazda, and Nissan thrown in for good measure. That collection of companies sold approximately 100 times as many cars as Tesla did in 2019. But Tesla isn’t the craziest thing that happened this year, and that is true even if we restrict ourselves to looking only at electric vehicle companies named after Nikola Tesla. This spring a would-be Tesla called Nikola went public via a reverse merger with a SPAC9 at a valuation of $3 billion. In the 2020 EV frenzy, it rose 10-fold to a market cap of about $30 billion. This company is a rare bird in the stock market, a pre-revenue manufacturing company. In fact, Nikola is not only pre-revenue, having never sold any vehicles it has produced, it has also never produced a vehicle. Further, it has not even built the factory in which it aspires to build the trucks that it has yet to sell. This summer, a report came out detailing allegations that almost all of the claims of Nikola’s Elon Musk wannabe founder over the few years of its existence were lies. That founder, Trevor Milton, was forced to resign and the company has yet to meaningfully refute any of the claims made in the report. The stock duly fell, but even after information came out showing that pretty much everything the company has claimed to accomplish in its history was a lie, it still has a market cap more than three times its value at its public debut less than a year ago – a valuation that was presumably predicated on the company’s claims actually being true.
With a combination of some the highest valuations ever seen and clear corresponding manic investor behavior, it seems clear to us that Growth stocks are indeed in a bubble.
What about the “Catalyst”?
The question of what will drive mean reversion for Value is the most common question we get from clients today, for understandable reasons. Value has been losing for a long time and valuation itself hasn’t been able to arrest the underperformance. Hearing us say we don’t know what the catalyst will be is not that reassuring, even if it has the benefit of being true. That’s not to say we don’t have any ideas. A return to more normal economic times could certainly be a catalyst, and indeed the news of strong results from vaccine candidates has led to strong returns for Value for at least a day or two at a time. This market response certainly makes sense – the average Value stock relies more on the kind of face-to-face activity that the pandemic has made difficult than is the case for the average Growth stock. If it is indeed the case that widespread vaccination allows the world to come back to something like normal by the end of 2021, it seems very likely be a continuing net positive for Value. Given the scale of the discount at which Value stocks are trading, the move from that alone could be quite large. A potential further catalyst in that vein would be interest rates rising above today’s rock-bottom levels. Even a relatively small upward move would be positive for sectors such as Financials, which are overwhelmingly Value stocks. If rising inflation were to cause the interest rate move to be a sizeable one, it would be difficult to believe that Value as a whole would not outperform quite strongly. None of these events strike us as implausible, although we think the likelihood of an eventual normalization of the economy is close to certain, whereas rising inflation rates are merely a possibility.
But our belief in Value from here is not driven by a belief in any of these potential catalysts per se. That is partially because we don’t think we are particularly good macroeconomic forecasters, but mostly because even in hindsight the catalysts for market turns are often obscure. The cause of the 1929 and 1987 market crashes, the downfall of the Japanese equity market in 1989, and the bursting of the Tech, Media, and Telecom bubble of 2000 aren’t particularly obvious even decades after they occurred. And even if you knew what the economic catalyst for the turn was going to be, determining when you would want to take the leap into Value would be far from clear. At times the market looks ahead to the future state of the economy. At other times, it doesn’t even seem to pay much attention to what is going on in the present, let alone the future. Future financial historians may indeed declare that the release of the vaccine trial data in November 2020 marked the start of the great Value rally of the 2020s. On the other hand, they may not. We are far more confident that something will cause the turn than any one thing in particular will. Given the extreme level of the opportunity in Value today, we consider that the risk of staying on the sideline until the turn is obvious is a bigger risk than entering into the trade before we are 100% sure the bottom is in.
Conclusion
It has truly been a hellish time for Value. After years of disappointing investors, Value just experienced its worst 12-month performance in history. The long history of Value as a style shows that its best times are more or less always preceded by pain. As Value investors who have been suffering for it for over a decade, we can certainly attest that we have experienced enough pain to justify a wonderful run for Value stocks. But you don’t have to simply take it on faith that Value is well set up for better times ahead. The relative valuations of these stocks around the world are some of the cheapest we have ever seen, and a decomposition of the sources of Value’s return since it peaked in 2006 shows that if valuations were to merely be stable at today’s levels and the underlying fundamentals for Value and Growth were the same as they have been over the last 14 years, Value would beat the market by a decent margin.
Of course, we believe relative valuations will not merely be stable from here but will rise back toward their historical normal levels. Whether that rise is driven by absolute gains for Value stocks in the next few years or avoidance of losses from the bursting of the Growth bubble is hard to say. Over the next 5-10 years, most Value stocks around the world seem to us to be priced to give a decent real return, although that is more questionable for U.S. large cap Value stocks where absolute valuations are higher. For our part, we believe that the combination of a wonderful relative opportunity for Value and worrying absolute valuations for stock markets suggests that now is the right time to exploit this Value opportunity in a long/short framework, and that is the topic of the next part of this quarterly letter.
EQUITY DISLOCATION
How To Profit From A Growth Bubble
By Ben Inker
At GMO, we consider that finding investment bubbles is part of our DNA, and we’ve been trying to help clients profit from their breaking since our first long/short strategy in the UK in 1992.1 We built a long/short strategy to exploit the Tech, Media, and Telecom (TMT) bubble in 2000, and another to exploit the bubble in low quality stocks that built up in the run-up to the Global Financial Crisis (GFC) in 2008. This fall, we built a new one – the GMO Equity Dislocation Strategy – to try to benefit from what we see as a Growth bubble in global equity markets today. We succeeded in all three previous occasions in making good money for clients as the bubbles burst, and we have tried to learn from both our successes and failures in those episodes to build a strategy that we believe has the best chance of making material profits from the market’s eventual return to sanity. We believe the potential returns to this strategy may be close to the 80%+ returns we were able to achieve for clients invested in the GMO U.S. Aggressive Long/Short Strategy during the TMT event, given that the valuation disparities are similar to what we saw then.2 We are using the strategy in the multi-asset and liquid alternatives strategies the Asset Allocation team manages and we confidently recommend it to investors who still believe investment bubbles can be spotted before they have burst. Even investors who no longer heed the warnings of us seemingly out-of-touch Value investors might want to consider a small position in this kind of strategy as we believe the likely losses if we are wrong and markets are correct in their pricing today are much smaller than the potential gains if the markets are the ones making a mistake.
As the first half of this letter showed, it has truly been the worst of times for Value stocks on a relative basis, which capped off a decade of underperformance by having their worst relative year ever in the 12 months to September 2020. The depth and duration of the underperformance is more than enough to convince many investors that Value is dead, but we were able to show that more than 100% of the underperformance since 2007 was driven by falling relative valuations for the Value group. Holding those valuations constant, the Value effect would certainly have been weaker than in previous periods, but it still would have been positive. Moreover, it is not necessary to believe in Value as a secular return factor at all to believe that with today’s extremely wide valuation spreads it is a compelling tactical opportunity.
Exploiting the Opportunity
The question is, how do you try to exploit it? A natural instinct to try to profit from overvalued assets would be to simply short them. This turns out to be a tough way to make money unless you absolutely nail the timing. Volatility is your enemy any time you are shorting assets, and assets in a bubble tend to be pretty volatile. If you sell short an asset that rises 50% before falling 40%, the total return if you were long the asset would be -10% – a significant loss. But if you were short that asset and had to rebalance when you took losses, the return to being short the asset would also be -10%. The asset made a lousy long position, but due to its high volatility, a lousy short position as well. There is another possibility here that argues against a pure short. While Growth stocks today are trading at extremely high valuations relative to their history, it is possible that ultra-low fixed income yields have permanently lowered the required return to equities and Growth stocks are close to fairly valued. In that case, Value stocks are substantially undervalued and deserve to go on their own tear.
A long/short implementation not only lowers the volatility of the strategy relative to a pure short – lowering the volatility drag – but also makes money if the mispricing turns out to be on the Value side instead of Growth.3 GMO used long/short portfolios to exploit bubbles in the past to considerable success. Unlike those earlier times, today the market offers a variety of ETFs that are easy to go long and short. Maybe the right way to express today’s opportunity is through them? We do not believe so for a couple of reasons. First, the Growth and Value indices they represent are much less diversified than they seem. As of September 30, 2020, Apple is about 11% of the Russell 1000 Growth Index and the FAANGM stocks as a whole are about 40%. Even assuming you believe Apple or the FAANGMs are significantly overvalued, there is certainly a meaningful chance they can outperform despite that fact. Why would you want to allow an error on one or a few companies to blow a hole in your strategy’s performance?4 While Value indices are today somewhat less top-heavy, the largest names in the Value universe are almost definitionally not going to be the cheapest ones. If you are trying to exploit the mispricing of Growth stocks relative to Value stocks, it makes far more sense to bias your position weights toward the cheapest and most expensive companies rather than the largest.
Another problem with style index expressions of the trade is that the sector biases are enormous. Technology is 40% of most Growth indices and less than 10% of Value indices. That 30% net short position functionally dominates the risk of the trade.5 While technology stocks have been on a tear and many of them look quite expensive today, that is a huge risk concentration. Value indices have their own concentration issues in financials. Financials undoubtedly are trading cheap on many measures, but the challenges of a world of unprecedently low interest rates argue against turning a Value trade into a concentrated bet on that sector.
It is our belief that the right way to build a long/short strategy to exploit the Growth bubble today is to limit both individual stock weighting and the size of the net biases for or against industries, sectors, and other return factors to ensure that the strategy has a diversified set of exposures that are connected to the Growth versus Value mispricing. Our goal is to be as true to Value as we can be. The question is, how should we define Value?
Building the Right Value Model
At GMO, we have always believed there was far more to sensible Value investing than simply buying the cheapest stocks on traditional valuation models. Even before the founding of GMO, Jeremy Grantham and Dick Mayo organized their arguments over which were the most attractively priced stocks by restricting their discussions to a handful of inputs to the dividend discount model they used for valuing every stock in the portfolio. That model had a few key assumptions – that growth was only worth paying for if it was accompanied by a high return on capital (ROC), that all growth was paid for by reinvesting retained earnings, and that while any company could be a buy if the price were low enough, higher quality companies were worth a substantial premium over junky ones. Once GMO was up and running and Jeremy and Chris Darnell started our quantitative investing efforts in the early 1980s, their first big project was systematizing the dividend discount approach that Jeremy and Dick had started using a decade earlier.
When we saw an extraordinary opportunity for Value stocks 20 years ago, the tool we used to build the portfolio was that dividend discount model. It worked well, and the GMO U.S. Aggressive Long/Short Strategy was able to capture returns of 80.3% net of fees as the TMT bubble deflated from October 1. 2000 through the end of 2002. And yet, despite the success of both the model and the product, within a few years we had moved away from the dividend discount model in building our quantitative equity portfolios. Why? The reason hinged on increasing problems with the book values and earnings figures we needed to calculate the profitability for growthier companies.
Much has been made of the way that changing business models have rendered standard valuation measures useless. There is an element of truth to this, but as is often the case, proponents seem to overstate their argument. The case for capitalizing line items such as advertising, research and development (R&D), and even some parts of sales, general, and administrative (SG&A) expenses is pretty compelling, but the impact of doing so is small for many companies.6 And actually, the biggest problem for price/book, which is today the most problematic of the “old style” Value metrics, has much less to do with which expenses are being capitalized than the fact that companies have spent so much money buying stock back at a multiple of book value over the last 25 years. This was going to be a problem without any of the other accounting issues, and the fact that so many of the buybacks were funded by debt would have rendered price/book a massively problematic measure even had the buybacks occurred in the 1970s instead of the 2000s. Any investor who was paying attention even 50 or 60 years ago knew that book value systematically understated the true assets of companies. The evidence was not merely that most stock markets had traded above book value the majority of the time, but that overall corporate growth was hugely less than what would have been the case if companies really had a return on equity (ROE) as high as was suggested by GAAP ROEs.
It’s easy to see this using the U.S. as a case study. In the period from 1950-2000, the average stated ROE of the S&P 500 was 12.5%, the average dividend payout ratio was about 50%, and the real growth in earnings per share was 2.2%. Had the true ROC for corporations been anything approaching that 12.5% figure, earnings growth would have been far higher, as we can see in Exhibit 1.
EXHIBIT 1: S&P 500 ACTUAL AND THEORETICAL EARNINGS IF ROEs WERE UNBIASED
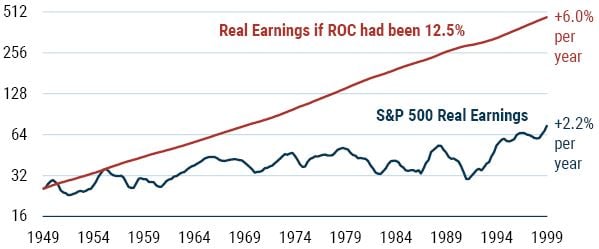
Data from 1950-2000 | Source: Compustat, Bureau of Labor Statistics, GMO
Book value must have been understated relative to the true net worth of companies, because the true return on retained earnings for companies was obviously far below what ROEs implied should be the case.
The point of this analysis is to say that book value has always been a flawed measure of the true value of either an individual company or the stock market as a whole. The reason why it has become far more flawed in the last 25 years or so in the U.S. market and somewhat more recently in other markets is partially a change in business models but mostly the rise of stock buybacks, particularly debt-financed buybacks. Fixing that problem requires adjustments that must be recalculated every time a company issues stock or buys it back. Between employee stock option exercise and buyback activity, that means more or less continual tweaking for thousands of companies. Why do we bother? Because it is essential to determining what the internal ROC is for companies, and that ROC is the key to determining which companies are worth paying a premium for. Twenty or thirty years ago we could get away with making a blanket adjustment to book values to get meaningful estimates of ROC for the bulk of companies. As the distortions grew, however, this blanket adjustment became untenable.
We adapted to this problem by adopting a multiple-models approach to Value, using a number of different Value parameters to try to triangulate our way to an estimate of the fair value of companies. This method has robustness on its side, but it is not well-suited to differentiating between the expensive stocks that are worth their premium valuations and those that are not. By using this model alongside models that do a decent job of predicting growth, you can generally get around that problem, and that is the approach the Global Equity team has used in recent years to build its portfolios. But for building the Equity Dislocation Strategy, Simon Harris – the head of the GMO Global Equity team – and I did not believe that approach would work.
The core reason for that belief is that the Equity Dislocation Strategy is predicated on an assumption that the Growth bubble will deflate, and that would necessarily entail a shift in market leadership relative to the past several years. Most of the models we have that do a decent job of predicting growth have a momentum flavor to them. This is usually not a problem because stocks usually do trend, and Value generally has a strongly anti-momentum bent that often hampers its return.7 But for a strategy that is specifically intended to capture returns from a reversal in market leadership, momentum models are likely to keep you away from the very stocks where the market has taken things too far. While it is possible that the turn for Value could be a gradual one in which the best and worst performers gently converge to both give market performance for a while before reversing course, it seemed unwise to us to count on such behavior. As an example of the potential for sharp reversals, on November 9 Value indices had one of their best days of relative performance in history, with the Russell 1000 Value outperforming the Russell 1000 by 3% and EAFE Value outperforming EAFE by 1.5%. But it was also one of the worst days in history for momentum, with the iShares MSCI USA Momentum Factor ETF underperforming the S&P 500 by 4%. Biasing your Value longs toward high momentum and your Growth shorts toward low momentum could easily have turned an epically good day for a Value long/short into a wash or, potentially, a loss.
And if we were not going to use momentum models, our standard value model, even with its adjustments for company quality, could not do a good enough job differentiating between the companies that looked expensive but deserved their premium valuation from those that were merely overpriced. The dividend discount model could do this, but only if it had decent inputs that were free of the distortions that had infected accounting data over the last couple of decades.
The good news was that Simon Harris and his team had spent the previous four years painstakingly fixing all of the distortions they could find and rebuilding every company’s balance sheet and income statement in a more economically sensible fashion. This put us in a position to do the rebuild of the dividend discount model that Jeremy Grantham had been agitating about for years. Only with every major distortion corrected did Simon believe we could give the model good enough inputs to be able to differentiate properly among Growth stocks. By the end of last year, we had completed that work just at the time when the valuation spread between Value and Growth had gotten wide enough that we began seriously discussing a Value-driven long/short strategy.
There was much more to the rebuild than just fixing the inputs, however. The assumptions we made 20 years ago about the regression rates of ROE were no longer valid – not just because the passage of time gave us more data to examine, but also because by fixing the data company by company instead of making broader adjustments, the rate of profitability regression was going to be quite different. This year became a race to do the work required to rebuild the dividend discount model before the Growth bubble burst. While the unfolding rout in Value stocks across the year was painful for us in many ways, the silver lining was that the opportunity was growing as we labored to build the tools to exploit it. It made for a lot of long hours, particularly for Simon and Carl O’Rourke, who were at the heart of the rebuilding effort, and it also involved a lot of helpful advice from quantitative and fundamental investors across GMO whom we enlisted to help us make sure the model followed our collective best ideas about the underlying economics that drive company results. By early this fall, the model was complete.
Portfolio Construction
The question of how to build a portfolio like this is quite different from a strategy that is designed for success across the entirety of the market cycle. Portfolio construction for an “all weather” portfolio often focuses on minimizing drawdowns and controlling exposure to anything that has a significant amount of volatility to it. For a strategy like Equity Dislocation, however, our goal is not to clamp down on all the risks we know about besides “value.”8 It is impossible to separate “valueness” entirely from other factors, and we believe if you push too hard in an attempt to reduce every risk you know about, that simply leaves you exposed to the risks you were blind to. And because clamping down on all the risks you knew about would naturally leave you with a portfolio that looked low volatility historically, you would probably wind up levering up that “low risk” trade just in time for some new factor to bite you.
So, we chose not to eliminate all of the industry sector and factor bets, but to make sure the strategy has a diversified set of the bets that are driving the dislocations in today’s equity market, without excessive risk on any one of them. So if, for example, vaccines prove less effective or slower to be distributed than the market expects but the global economy adjusts and economic growth winds up pretty good despite continued social distancing, our loss on “reopening plays” will hopefully not overwhelm the gains on a net bet on cyclicals. And in a world where software companies trade at massive multiples of revenue on the hopes that each of them will replicate the spectacular success of the handful of past winners, it seems clear that a Value strategy should want to be net short that industry. But if we were to allow that short to dominate portfolio risk, that would mean what we were running was not a Value strategy but a macro bet against software.
As a result, we chose to penalize sector and industry bets in a fashion that freely allows for relatively small bets but clamps down as the net positioning grows large. We did something similar with factors such as beta and size as well as common factors that emerge from an analysis of the most recent few years of cross-sectional stock returns. Even after controlling for every risk we could describe to our models, we knew there was the potential for others to sneak in, so we spent a good deal of time poring over the candidate portfolio to make sure it matched our investment intent. Only when we had completed that work and chosen our optimization settings did we run our first backtest.
What Does the Portfolio Look Like Today?
While a backtest can help show that a strategy would have made money in past events, it does not tell us whether today’s portfolio is at an extreme. For that, nothing replaces staring at the characteristics of the portfolio itself, which are presented in Table 3 and Exhibit 3.
TABLE 3: CHARACTERISICS OF GMO EQUITY DISLOCATION STRATEGY
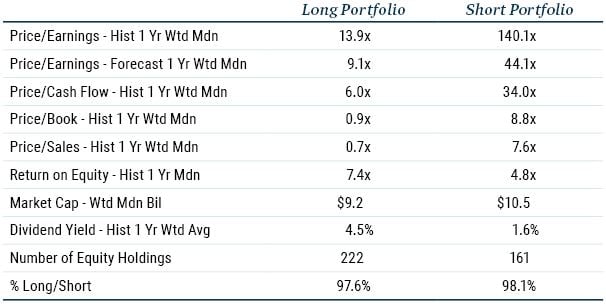
Data as of 10/31/2020 | Source: GMO
EXHIBIT 3: REGION AND SECTOR WEIGHTS OF GMO EQUITY DISLOCATION STRATEGY
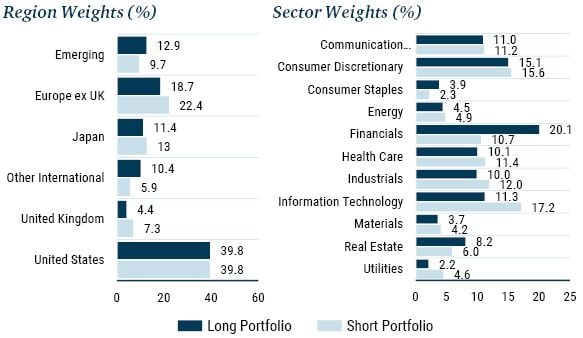
Data as of 10/31/2020 | Source: GMO
Despite moderately-sized net sector bets and broadly diversified positions across sectors and regions, we were able to build a portfolio with the median long position trading at 1/10th the price/earnings, price/book, and price/sales of the median short, and with almost 6 times the cash flow yield, 5 times the forward earnings yield, and almost 3 times the dividend yield. The median holding on the long side trades at a 58% discount to the average stock on our dividend discount model, and the median short position trades at over a 380% premium. That makes for about a 12:1 ratio, which is very similar to what we saw at the height of the TMT bubble.
We are confident the strategy is a reasonable and robust representation of the basic dislocation in equity markets today. It is by no means a low-risk strategy, but we believe its risks are balanced and appropriate in service to profiting handsomely from a recovery in Value, whether that recovery comes in absolute or relative terms.
Where Does the Portfolio Fit?
We built the Equity Dislocation Strategy first and foremost to benefit our multi-asset and liquid alternative strategies, and it is now a piece of all of the asset allocation strategies we run where a low-beta, high-volatility strategy fits in the mandate. We believe it would make sense for other investors as well. For investors who have maintained their belief in the concept of reversion to the mean, this strategy can be a means to turbo-charge a portfolio that otherwise has already built into a Value bias. At today’s valuations, we forecast that Value-oriented equity portfolios will make good money over the next seven years, particularly strategies that avoid the egregiously expensive U.S. stock market. But whether they make much money in absolute terms in the next two to four years really depends on whether the generally high valuations across the world prove sustainable, and we are far from certain that they will be. Given that Equity Dislocation can make money whether Value wins in a stable or rising market or in a declining one, we think a combination of long-only Value with Equity Dislocation has a superior risk/reward trade-off to just buying the cheaper stocks around the world today.
For those who no longer believe in reversion to the mean or never did so in the first place, let me put it this way. The last decade has seen extraordinary returns for your growth-oriented public and private equity portfolios. Perhaps the good times will continue, but there is surely some chance that the trade will not prosper so well in the next decade as it did in the last. A Value/Growth long/short portfolio should have a slightly positive expected return if relative valuations are stable from here, would take some losses if Value spreads continue to widen, but could generate outsized gains if spreads were to shrink. A relatively small allocation to such a portfolio could hedge some of your vulnerability to a shrinking Value spread environment without requiring you to take much capital away from talented Growth and Venture Capital managers.
I am all too aware that for many investors a decade or more of disappointment has dimmed their enthusiasm for Value investing. The cruel logic of being a Value manager is that at the very time when your opportunities are at their best, your credibility with potential clients is at its lowest ebb. But, if the fact that you’ve read this far means that I’ve persuaded you that adding Value-driven long/short exposure to your portfolio has merit, then my colleagues and I stand ready to discuss how GMO can help.
Footnotes for - Value: If Not Now, When?
1 By the brilliant Oliver Sacks. A great read perhaps best kept for a less depressing year.
2 Ben Inker, “The Trouble with Value,” 2005.
3 We use a blend of sales, gross profit, book, and GMO’s proprietary economic book (which adjusts for various accounting flaws in regular reported book) so as to avoid the biases created by a single measure.
4 Where income is the sum of dividends and net buybacks.
5 Since the FAANGMs didn’t exist through all of history, we can also simply exclude the top 10 companies by market cap from the universe through all of history and select Value within that group to make a historically more reasonable comparison of relative valuations. Results are no different.
6 Investments in research and development or advertising, for instance.
7 In two 2019 pieces, “Value Investing: Bruised by 1000 Cuts” and “Risk and Premium: A Tale of Value” we explore this return decomposition in significantly more detail.
8 This was actually the title of an article published in the Ladies’ Home Journal in August 1929, in which Jacob Raskob argued that if everyone would only put $15 per month to work in the stock market, they could all expect to be able to live in luxury, spending $400 per month out of their accumulated stock portfolio within 20 years. While he didn’t specify exactly what return would be necessary to achieve that result, it turns out to be a trifling 26% per year. The actual return to the S&P 500 for the 20 years starting in August 1929 was 2% per year, affording a somewhat less luxurious $18 per month lifestyle.
9 A SPAC is a Special Purpose Acquisition Company – a shell that is created for the specific purpose of merging with some private company to take that company public more quickly than could have been the case with a normal initial public offering (IPO) process. While SPACs are not inherently a crazy idea, historically they have usually proved poor investments, and the fees associated with them are generally a lot higher than IPO costs. In 2020, at least four times more money has been raised through SPACs than in any previous year.
Footnotes and disclosures for - Equity Dislocation: How To Profit From A Growth Bubble