Dispelling Myths in the Value vs. Growth Debate
Executive Summary
After several strong quarters for value stocks, the last few months have seen a sharp reversal in favor of growth. Understandably, this has led some investors to question whether value’s run is over and whether value investing makes sense as anything more than a tactical play. While the brevity of value’s resurgence has been frustrating, it does provide me with an excellent opportunity to address some of the objections I hear from investors who are hesitant to join us in betting strongly on value today. Our conclusion remains that this is the most compelling opportunity we have seen for asset allocation alpha since the 1999-2000 internet bubble.
After two of the best quarters for value in at least a decade, the second quarter of 2021 saw a return of growth stock leadership and that move continued into July. The reversal actually started close to the end of the second quarter. As of June 3, the Russell 1000 Value index was 1.6% ahead of the Russell 1000 Growth index for the quarter. The rest of June through the end of July saw growth rise by 11% and value fall by 0.7%. It was frankly enough to trigger nightmares for a value manager.
But while this was certainly a disappointment for those of us positioned to benefit from a resurgence in cheaper stocks around the world, it did not come as a particular surprise. Habits once formed can be hard to break, and investors have had at least a decade to develop the habit of turning to U.S. large cap growth stocks amid feelings of rising uncertainty. There were similar moves in the two greatest periods of outperformance of value in my lifetime, 1973-77 and 2000-02. In the first period, U.S. large cap value ultimately outperformed U.S. large cap growth by 94% and in the second, U.S. large value outperformed growth by 114%. But within those astonishingly pro-value periods exist some of the best months for growth relative to value on record. In fact, 6 of the best 10 months for U.S. growth versus value in the period from 1971-2019 occurred in those two periods, which made up only about 13% of the total months.1 This pattern of great growth months in great value runs can be seen in Exhibit 1.
Exhibit 1: Monthly Returns of U.S. Large Value vs. Growth 1971-2019
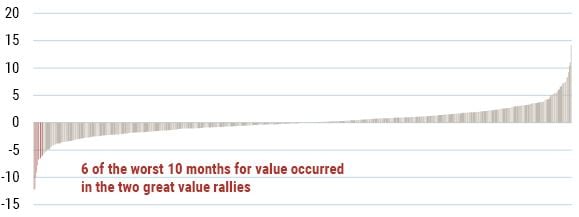
Source: Russell Investments, GMO, Compustat. From 1980-2019 performance is for Russell 1000 Value less Russell 1000 Growth. From 1971-79 performance is for cheapest 50% of price/book versus most expensive 50% of price/book in Top 1000 U.S. stocks.
But even if sharp reversals are a common occurrence during value runs, they also predictably bring out the arguments as to why the period of value outperformance was the anomaly and this is merely a return to the “normal” pattern of growth winning. As we have been getting plenty of such arguments and questions, it seems worthwhile going through a few of them here.
Argument 1: Value’s outperformance was due to an economic reopening, which is largely done or is going to reverse. Without that tailwind, growth should lead again.
Answer: The reopening trade that began with the vaccine trial news last fall was certainly good for value. This is partially because value stocks may be slightly more cyclical than growth stocks in general, but much more because sectors of the market that were severely hit by COVID wound up in value by virtue of their underperformance. An event that promised a reprieve from the socially distanced world was going to be great for those sectors. But there is no general pattern that growth outperforms value in bad economic times or vice versa. Exhibit 2 shows the relationship between the performance of value less growth and quarterly GDP growth since 1971.
EXHIBIT 2: Performance of U.S. Value vs. Growth Against Quarterly GDP Growth
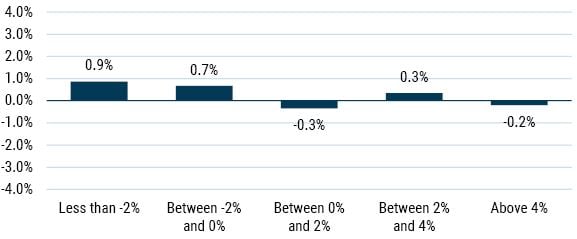
Data from 1970-2020 | Source: GMO, Bureau of Economic Analysis
There is, if anything, a slight tendency for value to outperform in economic downturns. On the other hand, the overall correlation between the two series is an insignificant -0.07, so I would caution against making too much of that. But certainly there is no broad reason to believe that value stocks require robust economic growth to do well: both of the great value rallies of the last 50 years contained recessions (1973-75 and 2001) and neither knocked value off its stride, with value outperforming growth by 15% and 8% annualized in those two recessions.2
Argument 2: Interest rates are falling again, and value is simply a play on rising rates.
Answer: I spent a good deal of time discussing the underlying fundamental reason we think this argument doesn’t hold up under fundamental examination in a piece earlier this year entitled “The Duration of Value and Growth.” But in the near term, despite the economic rationale for value and growth stocks to be similarly impacted by discount rates, it’s hard to be surprised that falling bond yields coincided with outperforming growth stocks. Exhibit 3 shows a chart of the longer-term correlations between the performance of value stocks versus growth and changes in bond yields.
EXHIBIT 3: 36-MONTH CORRELATION BETWEEN BOND YIELD CHANGES AND VALUE VS. GROWTH RETURNS
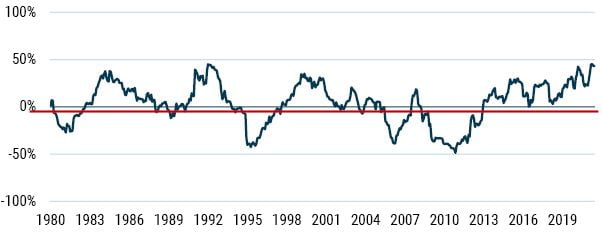
As of 6/30/21 | Source: GMO
U.S. Value – Growth represented by MSCI U.S. Value and MSCI U.S. Growth indexes. Bond yield changes based on 10-Year Treasury yields.
In the long run, the correlation between bond yield changes and value’s performance has been slightly negative, but recent years have seen a pretty strongly positive correlation. If history is a guide, this tendency is subject to change at any time, but if investors have been conditioned to expect such a correlation, it could easily persist for a while.
With regards to the outlook for value stocks though, this continued correlation is only a problem insofar as you believe bond yields will continue to fall. Changing bond yields even over the last 36 months have explained only 20% of the variance of returns between value and growth. While a continuation of that pattern would mean a slight headwind for value given falling yields and a tailwind given rising yields, it’s hard to make an argument as to why it is inevitable that rates should fall from here, or why anyone would want to structure an equity portfolio around that assumption.
Argument 3: Today’s business models have rendered most accounting data irrelevant, so isn’t investing on the basis of obsolete measures like P/E or price/book a fool’s errand?
Answer: Here at GMO we’ve got a good deal more sympathy for this argument than the first two. The fact that GAAP accounting hasn’t kept up with business models that are more dependent on intellectual property than tangible assets is unquestionably true. While it is worth remembering that book value was a highly imperfect guide to “true” economic capital even in the pre internet (and pre stock buyback) days, it is certainly more flawed now. We think the right response to the problem is not to give up on value as a style but to build better value models. GMO’s Global Equity team spent 4 years painstakingly rebuilding the balance sheets and income statements of over 10,000 companies going back over 40 years, capitalizing expenditures that we believe should have been considered investments and undoing the distortions created by decades of stock buybacks. This has not only given us improved versions of accounting-based valuation models that we believe are far closer to economic reality than what is embodied in the measures used to build style indexes, but we’ve taken advantage of that economically relevant data to build a forward-looking dividend discount model that we believe can also differentiate between companies where it is worth paying up for their future growth potential from those that are merely overvalued.
Argument 4: Value investing is hamstrung by value traps – companies that continually disappoint and take up space in the portfolio, costing you money. Won’t that always be the case?
Answer: Value traps are a fact of life for value managers. Sometimes an apparently undervalued company turns out to be “cheap for a reason.” Its fundamentals wind up deteriorating faster than expected and with hindsight it becomes clear that the stock wasn’t actually anywhere near as cheap as it originally seemed. But what has never seemed quite fair in the complaint about value traps is the fact that companies don’t have to be value stocks in order to have worse than expected results. It turns out that “growth traps” – companies that are priced for a level of growth that fails to materialize – are an even bigger problem in the growth universe than value traps are in the value universe. If we define growth traps and value traps as companies that both disappoint their revenue expectations and see their revenue expectations come down,3 we can see that they are an ongoing problem for both types of companies in Exhibit 4.
Exhibit 4: Value and Growth Traps as Percent of MSCI U.S. Style Groups
Data from 8/2000-7/2020 | Source: GMO, IBES
Most of the time, the prevalence of traps in value and growth are quite similar, although interestingly in both the run-up to the internet bubble and the period of its bursting there were substantially more growth traps than value traps.
But even if growth traps are at least as common as value traps, this only matters if they are similarly painful for investors that hold them. As it turns out, growth traps are even more painful on average, as we can see in Exhibit 5.
Exhibit 5: Value and Growth Trap Relative Performance
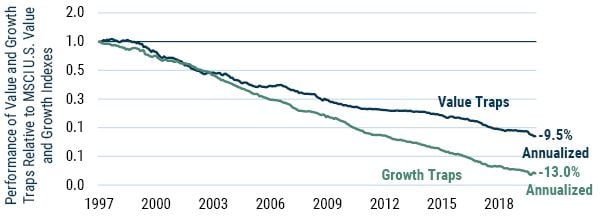
Data from 8/1997-7/2021 | Source: GMO, IBES, Compustat
As you can see, value traps have underperformed the value universe by a painful 9.5% per year, but growth traps have underperformed the growth universe by a huge 13.0%. Honestly, this should not be particularly surprising. Value stocks are, after all, companies that investors do not have a lot of confidence in. As like as not they got to be value stocks because they disappointed investors. Growth stocks, on the other hand, have lofty investor expectations and generally have a history of meeting or exceeding them. When growth stocks fail to measure up to those expectations, it is not a surprise that they are punished severely.4
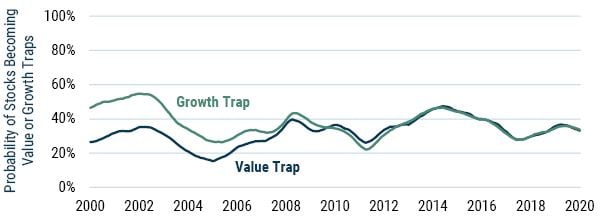
So why are value managers hounded with questions about value traps and “growth traps” doesn’t even seem to be a term in the lexicon? I can think of a couple of reasons. First, when a value manager buys a stock it is likely to be after it has already disappointed some prior investors. It seems like a perfectly natural question to ask why the manager thinks the stock won’t do it again. But my money is more on a second reason. When a growth manager buys a stock that turns into a growth trap, he/she is very likely to sell it, whereas a value manager might well hold onto a company that has disappointed as long as the price has fallen enough to compensate for the diminished outlook. I’m guessing it is the frustration of seeing the same stocks in the portfolio year after year even after they have disappointed that is most grating to clients. In defense of the value managers who can’t seem to learn from their mistakes, the autocorrelation of these disappointments is very low. The fact that a stock was a value trap in one period has more or less no bearing on whether it will be one in the next period, as we can see in Exhibit 6.
EXHIBIT 6: Probability of a Value Stock Becoming a Value Trap
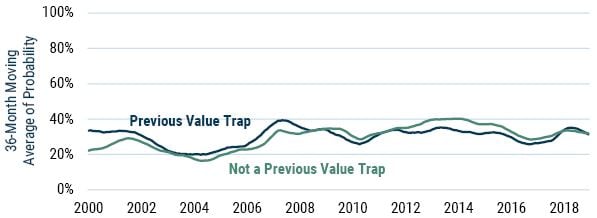
Data from 8/2000-7/2019 | Source: GMO, IBES
The probability of any particular value stock being a “value trap” in a given year is about 30%. This is true for value stocks that were value traps in the prior year, and it is true whether or not a company had earned the distinction in the prior year.5 But since 30% is a decent fraction of the value universe, on average 9% of the stocks in a value manager’s portfolio will have disappointed 2 years running, and 3% for 3 years running. One can easily imagine the frustration in seeing such stocks sitting in a portfolio that had cost them money for years. It is harder to imagine such stocks existing in a growth portfolio. But here is the basic issue. It really does make sense for a growth manager to sell stocks that have significantly disappointed. Such companies are legitimately less growthy than the managers were hoping they would be, and they are a less good fit in a growth-oriented portfolio.6 A value stock does not become less of an obvious fit for a value manager just because it has disappointed. Remember, most value stocks got to be value stocks because they disappointed investors somewhere along the line, after all. But just because growth managers sell their disappointments doesn’t mean those growth traps didn’t cost them money. On average, growth traps almost certainly cost the growth managers even more, it’s just that most of them are “new” traps instead of old ones.
Argument 5: Growth companies are simply better companies and make far more sense as long-term investments. You will never make 10 times your money in value stocks, whereas some growth stocks have risen well over 100-fold in the last 20 years. Growth stocks are destroying old companies and are changing the world.
Answer: It is almost invariably the case that the greatest buy and hold returns will come from successful growth companies.7 One dollar invested in Amazon on July 1, 2001 would have turned into almost $267 20 years later. But however obvious it may appear in retrospect that Amazon would become a colossus, picking winners is hard and the consequences of guessing wrong are generally severe. While it is not a fair analogy to equate buying Amazon stock 20 years ago to the purchase of a winning lottery ticket, what the two have in common is that an ex-post analysis of the results from those two outcomes is a lousy guide to the return to the general activity – purchasing highly priced growth stocks and purchasing lottery tickets.
Our quarrel in any event is not with growth stocks per se, but the idea that you can buy stocks without regard to the price you are paying because the future fundamentals will be so wonderful that the price is irrelevant. When growth stocks are trading at a relatively modest premium to the market, we generally forecast that they will outperform, and we did so more or less continually in the U.S. from the fall of 2004 until the middle of 2015.8 When the premium gets significantly wider than historical averages, we start to get nervous, and when we see the premium get to extremes, we start to wonder if speculative mania has set in. Today looks to us like a mania. Exhibit 7 shows the percentage of the U.S. stock market trading at over 10x sales.
EXHIBIT 7: Percent of U.S. Stocks trading over 10x Price/Sales
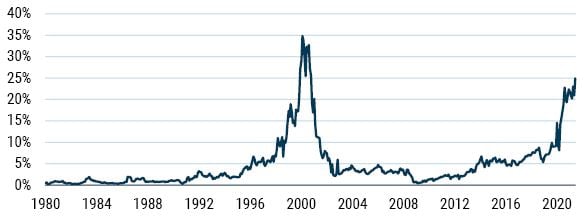
Data from 1/1980-6/2021 | Source: GMO, Compustat
While there is no particular magic about 10x sales being the unique true sign of overvaluation, it has gained a certain amount of fame from a statement that Scott McNealy, co-founder and CEO of Sun Microsystems, made to Bloomberg in 2002:
…2 years ago we were selling at 10 times revenues when we were at $64. At 10 times revenues, to give you a 10-year payback, I have to pay you 100% of revenues for 10 straight years in dividends. That assumes I can get that by my shareholders. That assumes I have zero cost of goods sold, which is very hard for a computer company. That assumes zero expenses, which is really hard with 39,000 employees. That assumes I pay no taxes, which is very hard. And that assumes you pay no taxes on your dividends, which is kind of illegal. And that assumes with zero R&D for the next 10 years, I can maintain the current revenue run rate. Now, having done that, would any of you like to buy my stock at $64? Do you realize how ridiculous those basic assumptions are? You don't need any transparency. You don't need any footnotes. What were you thinking?9
It is not strictly impossible for a stock trading at 10x sales or more to give a good return. Amazon was trading at well over 10x sales in the fall of 1999, and the return from then has been a very healthy 18% annualized, or 38x total gain over 22 years.10 On the other hand, Amazon did fall by almost 93% from that peak to the low 2 years later, and an investor who had held off and only bought when its price/sales fell below 10 in late 2000 would have made 89x his initial investment and saved himself a good deal of initial pain.11
But the more important point is that the odds are strongly against companies trading at over 10x sales. Exhibit 8 shows the long-term real returns to a portfolio of stocks trading at 10x sales or more against the overall stock market.
EXHIBIT 8: Performance of Stocks Trading over 10x P/S vs. Indexes
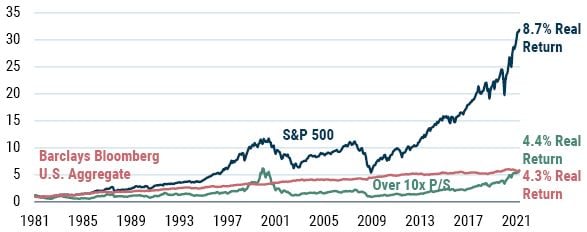
Data as of 6/30/2021 | Source: GMO, Compustat, Standard & Poor's
The over 10x P/S portfolio is a market capitalization weighted portfolio of all stocks trading above 10x trailing 12-month sales, rebalanced monthly.
The 10x sales cohort has underperformed the market by over 4% per year since 1980, reducing a 30x real gain over the 41 years in the S&P 500 to less than 4x, almost precisely in line with the Bloomberg Barclays U.S. Aggregate Bond index. While it is not impossible to prove worthy of such a high valuation, it takes extraordinary results to do so. And investing where it will take something extraordinary to earn a good return has generally been a bad idea despite the existence of a handful of exceptions to the rule.
Today, a full 25% of the U.S. stock market is trading above that 10x sales multiple, far higher than any time in history apart from the peak of the internet bubble in 2000. Will some of those companies prove worth their valuation in the long run? Almost certainly. But if history is any guide, the vast majority will not.
Argument 6: Value recently made a nice tactical rally from October to March, but the secular trend remains in favor of growth.
Answer: This argument feels particularly weird to me if “secular trend” is shorthand for a belief that growth should outperform value in the very long term. A belief in a permanent premium for growth stocks requires a belief that they will continually be underpriced. For growth stocks, as with any asset, returns are a function of the price you pay. No matter how wonderful a company’s prospects, there is necessarily some valuation that would make the company’s stock a poor investment. In order to believe growth stocks are going to permanently outperform, we need to believe that investors will durably fail to price them high enough, and value stocks low enough, for value stocks to have a similar expected return. It’s hard for me to imagine a reason for that. While growth stocks have historically had a higher beta than value stocks, there is no evidence whatsoever that investors have punished high beta stocks with artificially low valuations, and indeed high beta stocks have proven a poor investment over time. Growth stocks tend to be higher quality than value stocks, which helps them survive economic downturns better. Because severe economic downturns are the most important long-term risk equity investors face, that would be an argument for growth having a lower equilibrium return, not a higher one. And the great successes in the stock market are almost invariably stocks that are or were growth companies. After all, a giant market cap is either a sign that investors have such faith in the future prospects of your company that you are currently priced at a huge multiple (i.e., Tesla), or that you have such utterly huge profits that you must have grown immensely to get to that point (i.e., Apple). Either way the story is a growth story, and people pattern their actions around stories that have been successful.
Economically and behaviorally, it is significantly easier to believe there would be a long-term return premium for value stocks. They are generally more vulnerable in economic downturns, and that would economically warrant at least a small premium going to investors willing to hold them. Offering that premium would also make sense for the companies issuing those equities, because the added safety to those companies in funding their investments with equity versus debt is worth paying a higher return in the long run. Behaviorally, being a value investor requires doing things that humans tend to find uncomfortable, and it's not too hard to believe that there might be some extra discount (and consequently future return premium) to assets that have those features. It’s hard to imagine a persuasive argument around a permanent outperformance by growth, and that is no less true even if you don’t agree with my case for a secular tailwind for value stocks.
But there is an alternative interpretation of the argument. That would say that even though growth stocks should not be expected to outperform in equilibrium, they deserve to outperform today. This seems a somewhat less extreme statement than the first interpretation, but I find it no less mystifying. If growth stocks will perform similarly to the market in the long run but deserve to outperform from here, it logically must be the case that they are undervalued presently. Exhibit 9 shows the current valuation spread between value and growth in U.S. large caps.
Exhibit 9: value is Extremely Cheap
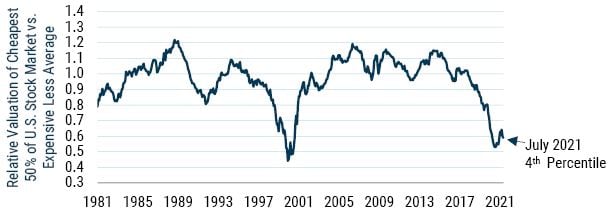
As of 7/31/21 | Source: GMO
Composite Valuation Measure is composed of price/sales, prices/gross profit, price/book, and price/economic book. Value and Growth groups are both sliced over 12 months.
Value stocks are currently trading at a 40% discount to their historical average relationship with growth stocks. If you believe growth stocks are undervalued today, you would have to believe their undervaluation a few years ago when the relationship was approximately normal relative to history was absolutely epic. More importantly, your beliefs about the future prospects for growth stocks would need to be far better than they have delivered historically, even in the period of their outperformance. Exhibit 10 shows the sources of return for value stocks versus growth stocks over the past 15 years against the earlier period in which value stocks outperformed.
EXHIBIT 10: U.S. Value vs. Growth Relative Return Decomposition
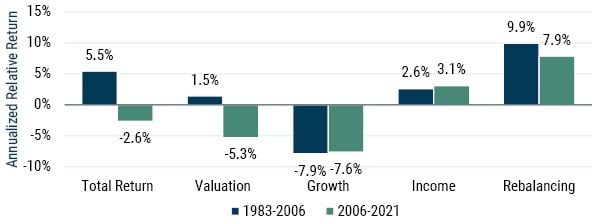
As of 1/31/21 | Source: Worldscope, Compustat, MSCI, GMO
U.S. Value defined as the cheap half on market cap within the U.S., U.S. Growth is the expensive half on market cap within the U.S.
Value stocks have underperformed by 2.6% per year since 2006. Their relative valuation has fallen by 5.3% per year. This means that more than 100% of their underperformance, and the outperformance by growth stocks, can be explained by the falling relative valuation of value stocks. A belief in a continued “secular trend” in favor of growth stocks therefore requires two beliefs. First, that the massive upward relative revaluation of growth stocks that we have seen in recent years understates the revaluation that they actually deserved, and second that this underreaction is due to a future outlook for these companies that is far better than anything they have achieved historically, including in the period of their recent outperformance. While there is no logical impossibility to those beliefs, they do seem pretty far out on the extraordinary scale. Anyone holding them really should have some awfully good evidence in their favor. The opposing view, that a group of stocks whose underperformance is more than explained by their falling relative valuations is actually cheap, seems a far less extraordinary claim. In order for it to be true, we merely need to believe that the future prospects of value stocks are not drastically worse than they have been in either the long term or the relatively recent past.
Argument 7: We live in a lower growth world than we used to. In that world it makes sense to pay up more for those companies that can actually deliver growth.
Answer: Economic growth has definitely slowed in the developed world since about 2005. GDP growth in the U.S. from 1983-2006 was 3.4%, and since then has averaged 1.5%. While the existence of the two deepest recessions since the Great Depression has depressed the latter figure, both population growth and productivity growth slowed markedly versus the earlier period and it’s far from obvious that the situation is going to change much any time soon. Correlation may not provide causality, but it is foolish to dismiss an argument that correlates decently well with what has occurred without reasonably thorough analysis.
So let’s try to delve deeper into what would have to be true in order for this argument to really hold water. The obvious way slower growth could lead to sustainably better relative returns for growth stocks would be if the gap between the growth of growth stocks and the growth of value stocks became larger. If the growth stocks grew at the same rate as always and the value stocks saw their growth fall, that would be an obvious justification for a wider valuation gap between value and growth stocks. But we saw in Exhibit 10 that the growth gap has been almost exactly what it had been in the earlier period of value’s outperformance.
Absent a change in the growth gap, it could still have been the case that growth stocks did a better job navigating the lower growth environment. If we imagine that value stocks did a poor job diagnosing the lower growth environment and invested too much, they might have achieved some growth but at too high a cost. In that situation, the cost would appear as lower payments to shareholders. We don’t see evidence of that, either, because the extra income for value stocks in the recent period has actually been a little higher than it was in the glory days for value. Both value and growth companies have responded in a refreshingly rational manner to falling aggregate growth rates, and their payout ratios (inclusive of stock buybacks and issuance) have risen accordingly.
There is, however, an aspect of growth’s performance since 2007 that has accrued to the benefit of growth investors over and above the windfall of rising valuations. In Exhibit 10, it shows up in the “rebalancing” bars. Rebalancing always accrues to the benefit of value relative to growth because the process of a value stock becoming a growth stock is almost invariably good for the holder and the process of a growth stock becoming a value stock is almost invariably bad. The size of the benefit to value and negative to growth is largely a function of two factors – the spread of valuation between value and growth stocks and the probability of growth stocks becoming value stocks and vice versa. Since 2007, that rebalancing effect has been 2% worse for value than it had been in the earlier period – +7.9% instead of +9.9%. The average valuation gap between value and growth was about the same in the two periods12 so what has really gone on is that fewer growth stocks have turned into value stocks and vice versa. This is most strikingly true for the highest growth stocks. From 1983-2006, top quintile growth stocks remained in that group for 29 months on average. From 2007 on, they have remained in the group for 40 months, almost a full year longer. This is pretty cool from the standpoint of a growth investor, given these are the companies that suffer the largest valuation decreases when they fall from grace. The impact of their longer average span as high growth is almost certainly enough to explain the fall in the overall rebalancing effect.13
While it is not entirely clear whether this shift will persist into the future, for our part we assume it will. We have not, however, adjusted our estimated equilibrium valuation gap between value and growth to compensate. Why not? The reason is that the outperformance of value in the earlier period was a lot larger than we think it is reasonable to assume going forward. The value group outperformed growth by over 5% per year from 1983-2006, against a 1% assumption we have in equilibrium today (0.5% outperformance for value versus the market and equivalent underperformance for growth). There is plenty of room there for a friendlier assumption on the retentiveness of the growth group without requiring a wider than historical valuation gap.14 Honestly, our equilibrium assumption is sufficiently conservative as to imply that the valuation gap in the future should be meaningfully smaller than it has been in the past. Effectively, we are assuming that the fundamental drivers for value stocks will be worse than they have been in either the 1983-2006 or the 2007-2021 period.
Conclusion
I’ve spilled a lot of ink here dispelling many of the pushbacks we hear about value. Trust us. We get it. This growth cycle has been painfully long in duration and magnitude, and the growth rally of the last several weeks can easily seem like a return to the “normal” pattern after a couple of quarters of a value surge. We, like almost everyone, are social creatures who want to fit in and join the party. But we’re also patient, valuation-sensitive investors who have seen this story before. While companies and markets evolve (as do our equilibrium assumptions about the proper discount at which value should trade relative to growth), the valuation disconnect between value and growth has reached extreme levels today. We’ve heard many reasons why “it’s different this time” and growth is destined and deserving to outperform. At these relative valuation levels, our long-term bet is the opposite.
While a reversal like the recent one is frustrating to us, it is nothing out of the ordinary compared to growth moves in other strong periods for value. For our portfolios, it has also provided an opportunity to rebalance into today’s most undervalued companies. And in long/short strategies such as the Equity Dislocation portfolio we launched in late 2020, it has also given us the chance to reposition our shorts into those growth stocks whose valuations have now become the most egregious. Equity Dislocation’s weighting in our go-anywhere Benchmark-Free Allocation Strategy remains at approximately 20%.
Download article here.