Presenters
|
 |
Victoria Courmes
|
 |
Riti Samanta
|
Overview
How does one invest “safely” in emerging market local debt? In this session, we discuss the benefits and application of a quality-focused emerging market debt strategy that offers positive real yield differentials relative to developed markets,1 as well as drawdown protection and diversification relative to broad equity risk.
Contact Us to Watch the Replay*
*This content is intended for accredited investors only.
Key Points
- Higher quality emerging markets are identified as those with lower inflation, stronger internal and external balances, and relatively low correlations to broad equity risk. This creates a slowly changing portfolio that adapts to improving fundamentals through time. We consider accessibility and liquidity to ensure broad, liquid exposure in quality emerging markets.
- Relative to DM exposure, we’ve found that quality EM has stronger returns and an improved risk/reward ratio. Importantly, the quality EM portfolio has far lower losses than equity markets during major equity market drawdowns (if not explicitly positive returns during those periods), reflecting the role of diversification and drawdown protection required from emerging market exposure in a multi-asset portfolio. The portfolio also offers meaningful positive real yields throughout the period – a refreshing difference from the consistently muted developed market inflation-adjusted yield environment.
- We believe this portfolio can serve as an anchor upon which we can layer complementary sources of alpha from our long-standing emerging market debt franchise. GMO’s Emerging Country Debt team’s emerging market rates and currency overlay programs serve as additional building blocks for client solutions.
Quality EM earns its place in your overall portfolio
We believe Quality EM can offer both safety and yield in your global portfolio
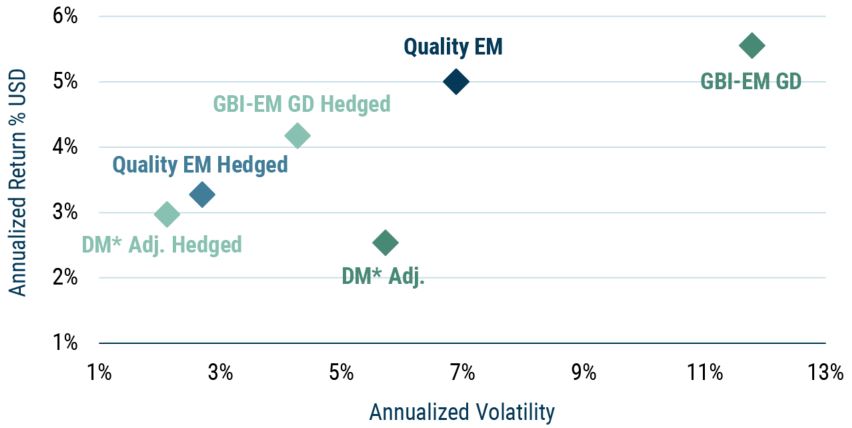
From June 2003 to September 2021
We approximate DM exposure ex-USA with J.P. Morgan GBI Global ex-USA index which we then adjust for duration differential to Quality EM portfolio and annotate as DM* Adj.
Past performance, whether hypothetical back-tested or actual, is not predictive of future results.
Please see the disclosures below.
1 Developed markets (DM) is defined as the JP Morgan Global Ex-US Index, adjusting for duration to match the duration of the emerging markets universe. Emerging Markets (EM) is defined as the constituents of the JP Morgan Global Diversified Index.
Limitations of hypothetical back-tested performance. The performance presented reflects hypothetical back-tested performance an investor may have obtained had it invested in the manner shown and does not represent performance that any investor actually attained. The back-tested performance presented is the result of systematically ranking the levels and trends in the variables listed above on a regular monthly basis to construct a simulated portfolio. The risk and reward characteristics relate to the performance of that portfolio from Dec 2003 – Sept 2021.
No representation or warranty is made as to the reasonableness of the methodology used or that all methodologies used in achieving the returns have been stated or fully considered. Back-tested returns have many inherent limitations and may not reflect the impact that material economic and market factors may have had on the decision-making process if client funds were actually managed in the manner shown. Actual performance may differ substantially from the back-tested performance presented. Changes in the methodology may have a material impact on the simulated model returns presented. There can be no assurance that GMO will achieve profits or avoid incurring substantial loss. The back-tested performance is adjusted to reflect the reinvestment of dividends, other income and is net of estimated transaction cost and borrowing costs. Back-tested returns are gross of management or incentive fees. Actual fees may vary depending on, among other things, the applicable fee schedule and portfolio size. GMO’s fees are available upon request and also may be found in Part 2 of its ADV. Past performance is no guarantee of future results.
Disclaimer: The views expressed are through the period ending November 2021, and are subject to change at any time based on market and other conditions. This is not an offer or solicitation for the purchase or sale of any security and should not be construed as such. References to specific securities and issuers are for illustrative purposes only and are not intended to be, and should not be interpreted as, recommendations to purchase or sell such securities.
Copyright © 2021 by GMO LLC. All rights reserved.