Executive Summary
Though U.S. stocks are expensive relative to history, we consider the extent to which the elevated price to earnings multiple (P/E) of the S&P 5001 is driven by mix and composition effects along with the temporary impact of the global pandemic on some constituents’ earnings. On a “like-for-like” basis, and adjusted for the impact of Covid-19, valuations are significantly less extreme. Analysis of our Quality Strategy through this like-for-like lens shows our portfolio is reasonably valued, giving us confidence in ongoing strong returns for the strategy.
Looking at many traditional valuation metrics, the U.S. market appears to be quite expensive. Exhibit 1 shows the P/E of the S&P 500 over time; the index has risen to P/E multiples previously seen only near the peak of the tech bubble. If the index’s P/E were to revert to median levels, the resulting 46 ppt headwind to returns would lead to weak or negative investment results from the U.S. market over a multi-year period. The elevated P/E would thus appear to suggest that the U.S. market is remarkably overvalued.
EXHIBIT 1: S&P 500 P/E Vs. ITS HISTORICAL MEDIAN
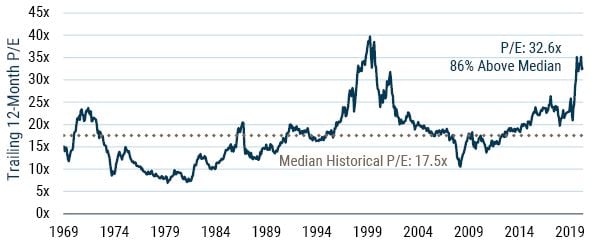
As of 3/31/2021 | Source: GMO, Worldscope
However, when GMO’s Focused Equity team evaluates individual equity investments, we do not assume that any given company’s high P/E is a signal that its stock should deliver poor returns. Many companies rationally trade at high P/Es, including those benefitting from strong secular trends or those delivering steady, recession-resistant earnings growth, and have performed very well over time. Indeed, our Quality Strategy has often traded at a higher aggregate P/E than the market, but this has been no impediment to its outperformance. It is when companies have significant increases in their P/E ratios that do not reflect changes to their underlying businesses that we are more concerned: either the market’s expectation for those companies’ growth has become elevated, increasing the risk of underperformance against expectations, or the market has become comfortable accepting a lower rate of return, even without a change in expectations for the companies’ earnings trajectories. Such increases in valuation also reduce future returns by driving up the price at which companies can repurchase their own shares, impairing the earnings per share growth algorithm of companies engaged in buybacks.
Our team believes this logic holds at the index level as well. If more of the index’s aggregate market cap becomes composed of companies that have generally held and merited high P/Es, either because they outgrow the index or because they represent more of the additions to the index than the removals, then the index’s average P/E will rise, but this “mix shift” would not necessarily be a warning sign for aggregate future returns. However, if the constituents in the index’s valuations rise against their own histories – that is, if their valuations rise on a “like for like” basis – then there would be reason to be worried that the market is overvalued.
The S&P 500 traded at 32.6x earnings on March 31, 2021, 86% above its long-term historical median of 17.5x.2 Exhibit 2 shows the magnitudes of the factors contributing to the index’s apparent valuation premium against its median historical P/E. Most of the rise in the market’s P/E is explained by a growing proportion of always-high-multiple stocks in the index, rather than by like-for-like increases in the multiples of its constituent companies. Excluding the effect of the mix shift, the market’s valuation premium falls to 20% above its historical median from 86%. Some of the remaining increase in valuation is attributable to the temporary impact of Covid-19 on 2020 earnings. Excluding the pandemic headwinds, we find that the market’s typical company is valued at 16% above its historical median. These valuation levels are somewhat elevated, but valuation work is inherently imprecise. A 16% elevation in valuations could potentially imply lower-than-usual forward equity returns, but it is significantly less extreme than the prevailing environment in 1999, when the typical stocks in the index became remarkably expensive compared to their own histories.
EXHIBIT 2: MULTIPLE EXPANSION WALK
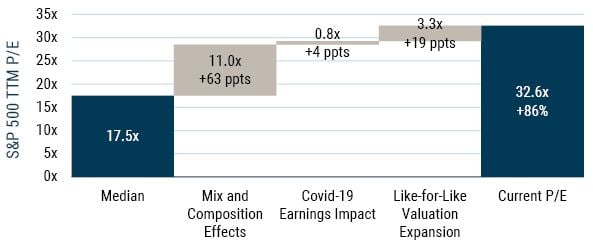
As of 3/31/2021 | Source: GMO, Worldscope
We are not so bold as to claim that our like-for-like analysis is a perfect methodology to assess the attractiveness of markets. Companies do change over time as their business lines develop and mature, and therefore a P/E that was appropriate in the past for a company may not be appropriate in the future. Additionally, the like-for-like analysis implicitly presumes that high-multiple stocks are not inherently less attractive than low-multiple ones. If low-multiple stocks are inherently more attractive and deliver higher returns over time, then the prevalence of high-P/E companies in the U.S. could prove a hindrance to future returns, though we would note that we believe the days in which simple value factors could deliver outperformance are behind us.
No solitary valuation metric is ever going to be ideal for measuring the market’s expensiveness, but this like-for-like quantitative analysis generally aligns with our bottom-up fundamental valuations of individual U.S. companies. That is, while looking for investments for our Quality Strategy, we continue to find that many prospective investments we have analyzed, including those with higher P/Es, are trading at valuations that are fairly reasonable given their prospects; individual stock prices are often slightly expensive, but generally not that far from our estimates of fair value. And importantly, we continue to find investments we believe are highly attractive at current share prices.
Exhibit 3 shows the cap-weighted median P/E of the S&P 500 divided by that median company’s own historical median P/E. That is, it is an aggregate measure of how expensive the typical company in the index is when compared to that company’s own valuation history. It answers the question, “By how much does the typical company trade above or below its typical multiple?” It is our tool to demonstrate, on a like-for-like basis, whether the constituent companies of the S&P 500’s valuations have generally expanded or contracted, and thus it effectively controls for mix effects.
EXHIBIT 3: S&P 500 “LIKE-FOR-LIKE” TTM P/E INDEX3
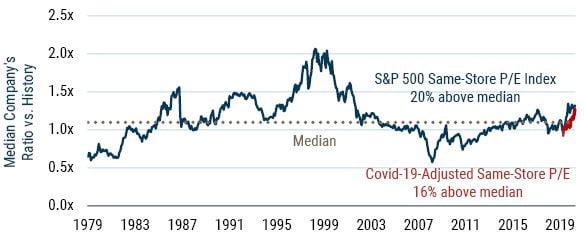
Data as of 3/31/2021 | GMO, Worldscope
Exhibit 3 demonstrates that most of the U.S. market’s increase in P/E is driven by a mix shift toward always-high P/E companies: the 20% increase in like-for-like valuations seen in Exhibit 2 leaves mix shift to explain the remainder of the 86% increase in valuation. Furthermore, we believe that some of the remaining rise in like-for-like valuations can be explained by the pandemic-induced recession’s impact on earnings. The pandemic hammered the profits of some U.S. companies in 2020, but we believe that these headwinds will generally prove temporary. We estimate the magnitude of this headwind using pre-pandemic consensus estimates for 2021 earnings as a proxy for where companies’ earnings would be without the impact of Covid-19. After adjusting for this headwind, we find that like-for-like valuations are 16% above their long-term averages. Elevated, but not so high that the market does not offer some attractive investments at reasonable prices, and not like the sort of valuation increases we saw in the tech bubble.
Our Covid-19 adjustment has limitations: it tries to answer the question, “What if Covid-19 had never happened?” by using pre-pandemic estimates for 2020 earnings, eliminating the overall headwind to earnings. But Covid-19 and the resulting fiscal stimulus has proved a net benefit to many companies, particularly in the technology industry. Our measure eliminates the pandemic headwinds and tailwinds both, and if those tailwinds prove more sustainable than the headwinds, our adjustment will have been too conservative.
To illustrate how mix effects can drive up the market’s P/E without necessarily making it less attractive, we look at the often-discussed “FAANGM” stocks (Facebook, Amazon, Apple, Netflix, Google/Alphabet, Microsoft). We use the group as a motivating example of the dynamics at play in the S&P 500, as the FAANGM companies are widely known and analyzed, and we believe most market participants would agree with us that in aggregate they are not and have not been wildly overvalued, even though they often trade at well-above-market P/Es. The mix effect we identify in this paper is not solely caused by FAANGM; they are a microcosm of the forces creating a wedge between the above-median P/E of the market and the like-for-like median of the market.
Exhibit 4 shows that these stocks are “expensive” today in the sense that they have high P/E multiples, above the market median.4 But they always have had high P/E multiples, and these stocks have done well over time because their strong fundamental results have more than justified their high multiples. The stocks have not proven to be “expensive” in the sense of being priced to deliver a poor return; their high multiples simply reflect attractive business prospects.
EXHIBIT 4: “FAANGM” P/E MULTIPLES5
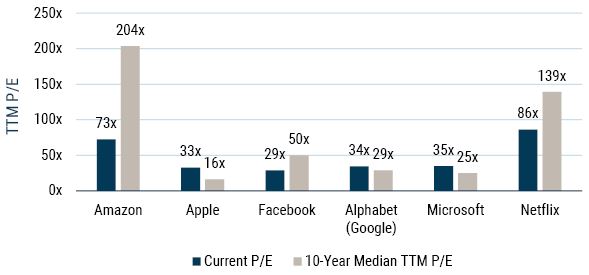
As of 3/31/2021 | Source: GMO, Worldscope
Because of their success, the FAANGM companies have grown to represent 21% of the S&P 500’s aggregate market cap as of March 2021, up from 11% 5 years ago. Importantly, this expansion was driven mostly by earnings growth. Profits of FAANGM as a percentage of the index have risen from 10% to 23% over the same period, though we would add the caveat that this anecdotal comparison is distorted by FAANGM’s especially strong fundamental and market performance through the pandemic. Because these companies generally have higher multiples than the S&P 500, their growing prevalence in the index is part of the mix effect pushing up the market’s P/E multiple. However, FAANGM P/Es are not necessarily inflated vs. their own valuation histories; half are cheaper than their own long-term averages, having grown into their premium multiples. In aggregate, they look like the market: somewhat expensive compared to their own histories, but not anomalously so. An anecdote is illustrative – at the peak of the tech bubble, Microsoft’s trailing P/E briefly exceeded 90x. As of this March it was at 35x.
We would be alarmed if each FAANGM company were very expensive relative to its own history (i.e., if their valuations had dramatically risen on a like-for-like basis), but we are not alarmed that FAANGM and numerous other high-growth and high-quality companies represent more of the index. Above-median multiple companies have outgrown the index, and new additions to the index have generally been at above-median multiples. Should the U.S. continue to produce many world-class companies deserving of high multiples, it is entirely possible that the trend toward higher market multiples could continue going forward, growing the universe of potentially attractive stocks for our Quality portfolio without any negative implication to future returns.
Exhibit 5 applies the like-for-like valuation analysis to our Quality portfolio. Like the market, our Quality Strategy has seen its like-for-like valuation increase. But we believe that the current expansion in multiples we are seeing is benign, as it is almost entirely driven by the negative impact of Covid-19 on some of our companies’ earnings. As with our analysis of the broader U.S. market, we use consensus estimates to systematically approximate the impact of Covid-19 on our companies’ earnings. We conclude that on pre-pandemic estimates of 2020 earnings the like-for-like valuation of our portfolio is 15% above its long-term average, just below the valuation premium of the S&P 500 when measured on the same basis. This valuation premium for our Quality portfolio is in line with levels we have seen leading into periods of strong absolute and relative performance for our strategy.
EXHIBIT 5: QUALITY STRATEGY PORTFOLIO LIKE-FOR-LIKE VALUATION
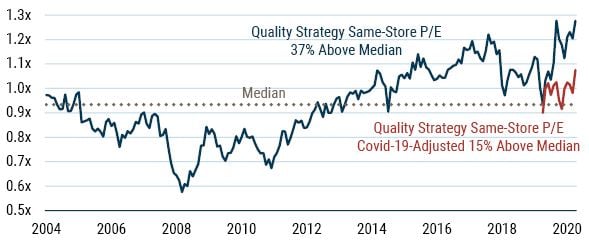
As of 3/31/2021 | Source: GMO, Worldscope
You may have noticed that our portfolio’s valuation is much more impacted by Covid-19 than the market overall. This is not an accident: we have made a thematic bet on “back-to-normal” quality stocks, companies that should benefit from the fading of the pandemic and the resumption of normal activities. As of March 31st, such stocks represent almost a third of our portfolio. These companies trade at high like-for-like valuations because their earnings fell so much last year. TJX, for instance, has had its sales badly dented at its T.J. Maxx and Marshall’s stores by Covid-19-induced closures and reduced traffic, but we expect it will soon achieve a better-than-ever recovery of earnings, as restrictions ease and normal commerce returns, driven by pent-up demand, high levels of household savings, and cost savings that can be at least partially preserved when sales resume. Because the market has partially priced in the temporary nature of the pandemic headwinds, the company’s valuation against its last 12 months’ earnings appears elevated, but we believe the underlying valuation is actually quite undemanding. The same broad logic applies to jet engine manufacturer Safran, catering giant Compass Group, beverages stalwart Coca-Cola, and others in our portfolio. While our shift toward these back-to-normal companies has driven up the P/Es of our portfolio versus history, we believe those apparently elevated multiples against current earnings will prove illusory as the world reopens and our investments’ earnings recover strongly.
Conclusion
Mix shifts in the S&P 500 and the impacts of Covid-19 on earnings have made aggregate valuations less informative than at any other time in recent decades. More than ever, we believe the index has many high-quality companies with attractive prospects, which has driven it to higher-than-usual multiples but created an attractive environment for picking Quality stocks. We believe that the actual valuation environment for the U.S. market, more appropriately measured, is elevated but still in the realm of the ordinary. And in ordinary times, the U.S. market has done well: over the last 10, 20, and 30 years, the S&P 500 has delivered 14%, 8%, and 10% annualized returns, respectively.6 Our Quality portfolio too, trades in line with like-for-like premiums seen at times of attractive returns for the strategy.
Like-for-like valuation analysis is certainly not the only lens through which one should look at market valuations. Regardless of their like-for-like valuations, stocks at high multiples do require strong business results to justify their prices, which inherently means a market at a higher multiple needs a stronger set of results to justify current share prices. But even with its limitations, we believe that our like-for-like analysis makes clear that the market’s overall valuation does not reflect the sort of environment we saw in the tech bubble, a time when the typical stock was trading at a wildly unattractive valuation. Our systematic analysis of the U.S. market is reflected in the many opportunities we see for our Quality Strategy: the mix shift in the U.S. toward higher P/E companies is in part a reflection of strong fundamental performance from higher-quality businesses with strong competitive advantages and long growth runways. We are very pleased with our success in finding attractive investments in the U.S. market. Thus, we look forward to what we believe will be continuing strong returns from our portfolio.
Download article here.